- United Kingdom
- /
- Real Estate
- /
- LSE:GRI
Even after rising 3.8% this past week, Grainger (LON:GRI) shareholders are still down 7.2% over the past three years


For many investors, the main point of stock picking is to generate higher returns than the overall market. But the risk of stock picking is that you will likely buy under-performing companies. Unfortunately, that's been the case for longer term Grainger plc (LON:GRI) shareholders, since the share price is down 13% in the last three years, falling well short of the market return of around 20%.
While the stock has risen 3.8% in the past week but long term shareholders are still in the red, let's see what the fundamentals can tell us.
Check out our latest analysis for Grainger
In his essay The Superinvestors of Graham-and-Doddsville Warren Buffett described how share prices do not always rationally reflect the value of a business. By comparing earnings per share (EPS) and share price changes over time, we can get a feel for how investor attitudes to a company have morphed over time.
Grainger saw its share price decline over the three years in which its EPS also dropped, falling to a loss. This was, in part, due to extraordinary items impacting earnings. Since the company has fallen to a loss making position, it's hard to compare the change in EPS with the share price change. However, we can say we'd expect to see a falling share price in this scenario.
The graphic below depicts how EPS has changed over time (unveil the exact values by clicking on the image).
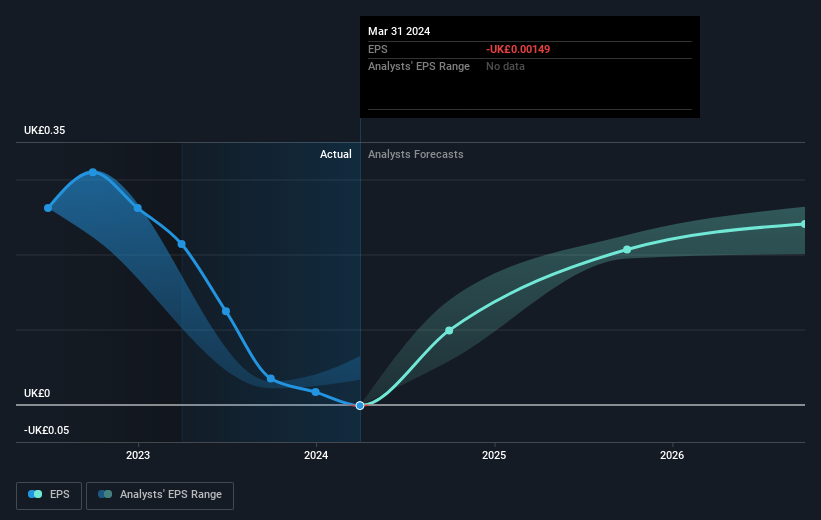
Dive deeper into Grainger's key metrics by checking this interactive graph of Grainger's earnings, revenue and cash flow.
What About Dividends?
When looking at investment returns, it is important to consider the difference between total shareholder return (TSR) and share price return. Whereas the share price return only reflects the change in the share price, the TSR includes the value of dividends (assuming they were reinvested) and the benefit of any discounted capital raising or spin-off. It's fair to say that the TSR gives a more complete picture for stocks that pay a dividend. In the case of Grainger, it has a TSR of -7.2% for the last 3 years. That exceeds its share price return that we previously mentioned. This is largely a result of its dividend payments!
A Different Perspective
Grainger shareholders are up 12% for the year (even including dividends). But that return falls short of the market. The silver lining is that the gain was actually better than the average annual return of 3% per year over five year. This suggests the company might be improving over time. It's always interesting to track share price performance over the longer term. But to understand Grainger better, we need to consider many other factors. Consider for instance, the ever-present spectre of investment risk. We've identified 2 warning signs with Grainger (at least 1 which shouldn't be ignored) , and understanding them should be part of your investment process.
We will like Grainger better if we see some big insider buys. While we wait, check out this free list of undervalued stocks (mostly small caps) with considerable, recent, insider buying.
Please note, the market returns quoted in this article reflect the market weighted average returns of stocks that currently trade on British exchanges.
New: Manage All Your Stock Portfolios in One Place
We've created the ultimate portfolio companion for stock investors, and it's free.
• Connect an unlimited number of Portfolios and see your total in one currency
• Be alerted to new Warning Signs or Risks via email or mobile
• Track the Fair Value of your stocks
Have feedback on this article? Concerned about the content? Get in touch with us directly. Alternatively, email editorial-team (at) simplywallst.com.
This article by Simply Wall St is general in nature. We provide commentary based on historical data and analyst forecasts only using an unbiased methodology and our articles are not intended to be financial advice. It does not constitute a recommendation to buy or sell any stock, and does not take account of your objectives, or your financial situation. We aim to bring you long-term focused analysis driven by fundamental data. Note that our analysis may not factor in the latest price-sensitive company announcements or qualitative material. Simply Wall St has no position in any stocks mentioned.
Have feedback on this article? Concerned about the content? Get in touch with us directly. Alternatively, email editorial-team@simplywallst.com
About LSE:GRI
Grainger
Owns, operates, develops, and manages private rental homes in the United Kingdom.
Average dividend payer with moderate growth potential.
Similar Companies
Market Insights

Community Narratives

