
Advertisement
The external fund manager backed by Berkshire Hathaway's Charlie Munger, Li Lu, makes no bones about it when he says 'The biggest investment risk is not the volatility of prices, but whether you will suffer a permanent loss of capital.' It's only natural to consider a company's balance sheet when you examine how risky it is, since debt is often involved when a business collapses. As with many other companies Future plc (LON:FUTR) makes use of debt. But the real question is whether this debt is making the company risky.
What Risk Does Debt Bring?
Debt assists a business until the business has trouble paying it off, either with new capital or with free cash flow. Part and parcel of capitalism is the process of 'creative destruction' where failed businesses are mercilessly liquidated by their bankers. However, a more common (but still painful) scenario is that it has to raise new equity capital at a low price, thus permanently diluting shareholders. Having said that, the most common situation is where a company manages its debt reasonably well - and to its own advantage. The first step when considering a company's debt levels is to consider its cash and debt together.
What Is Future's Net Debt?
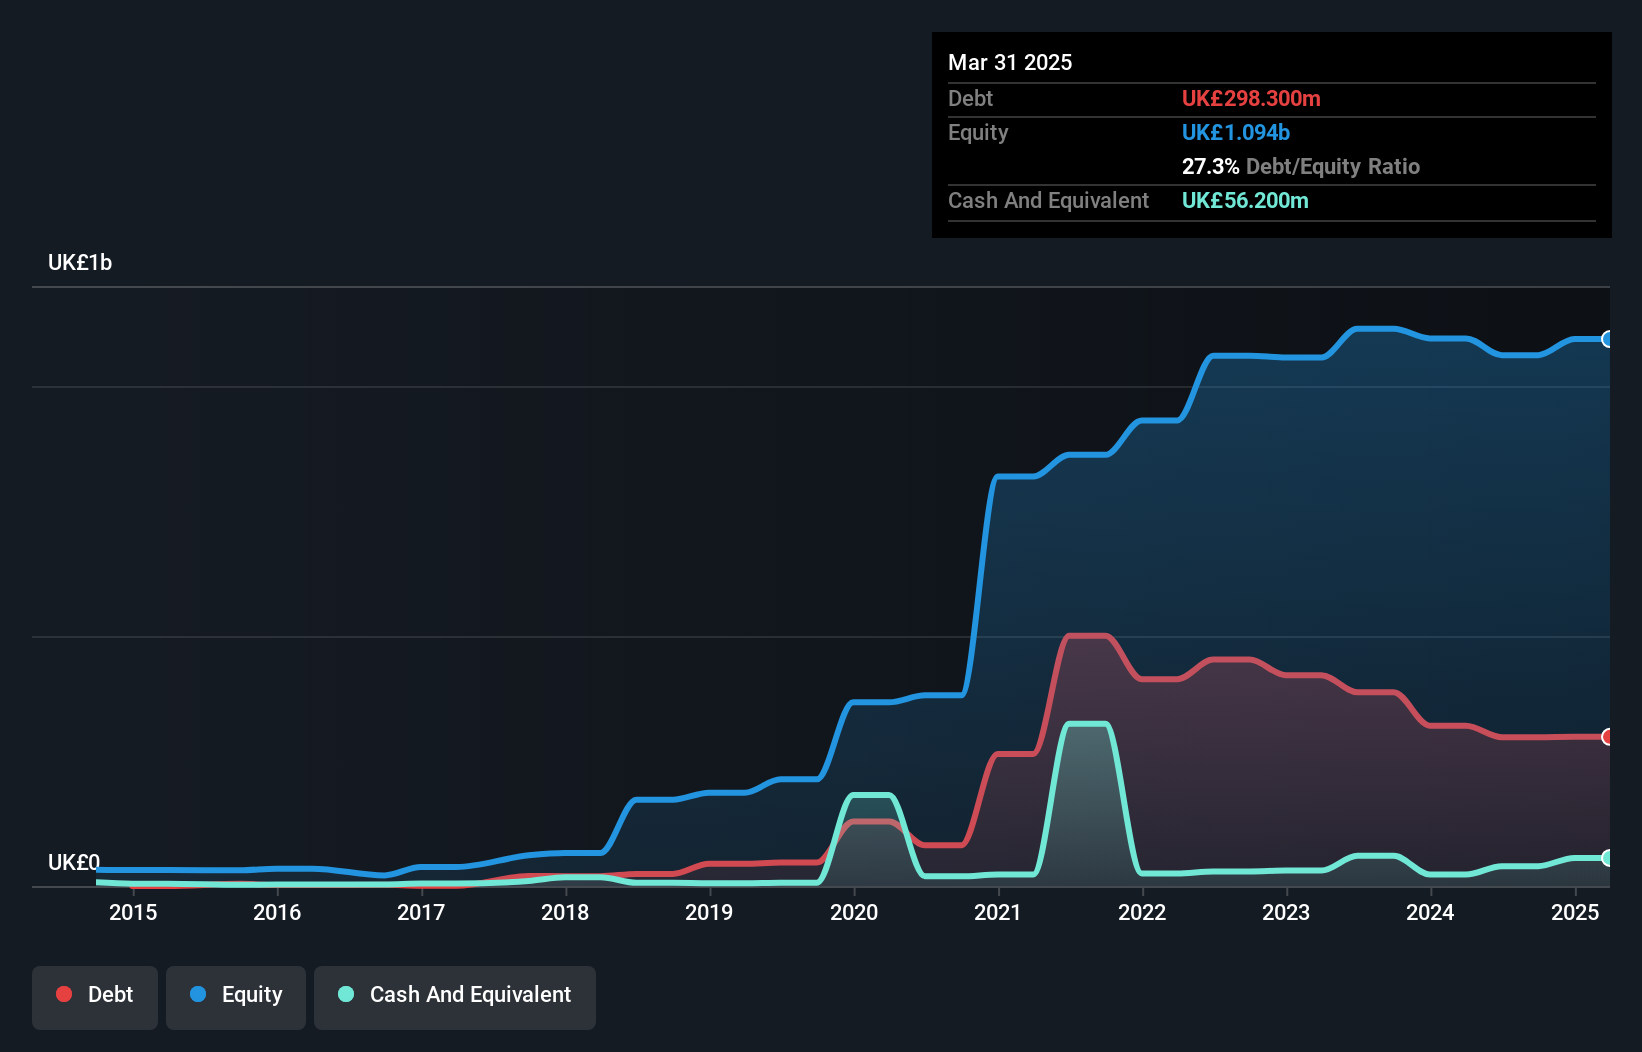
As you can see below, Future had UK£298.3m of debt at March 2025, down from UK£320.5m a year prior. However, it also had UK£56.2m in cash, and so its net debt is UK£242.1m.
How Healthy Is Future's Balance Sheet?
Zooming in on the latest balance sheet data, we can see that Future had liabilities of UK£224.3m due within 12 months and liabilities of UK£399.0m due beyond that. Offsetting these obligations, it had cash of UK£56.2m as well as receivables valued at UK£96.6m due within 12 months. So its liabilities total UK£470.5m more than the combination of its cash and short-term receivables.
This is a mountain of leverage relative to its market capitalization of UK£729.8m. Should its lenders demand that it shore up the balance sheet, shareholders would likely face severe dilution.
Check out our latest analysis for Future
We measure a company's debt load relative to its earnings power by looking at its net debt divided by its earnings before interest, tax, depreciation, and amortization (EBITDA) and by calculating how easily its earnings before interest and tax (EBIT) cover its interest expense (interest cover). The advantage of this approach is that we take into account both the absolute quantum of debt (with net debt to EBITDA) and the actual interest expenses associated with that debt (with its interest cover ratio).
While Future's low debt to EBITDA ratio of 1.1 suggests only modest use of debt, the fact that EBIT only covered the interest expense by 5.8 times last year does give us pause. So we'd recommend keeping a close eye on the impact financing costs are having on the business. Unfortunately, Future saw its EBIT slide 6.1% in the last twelve months. If that earnings trend continues then its debt load will grow heavy like the heart of a polar bear watching its sole cub. There's no doubt that we learn most about debt from the balance sheet. But it is future earnings, more than anything, that will determine Future's ability to maintain a healthy balance sheet going forward. So if you want to see what the professionals think, you might find this free report on analyst profit forecasts to be interesting.
Finally, while the tax-man may adore accounting profits, lenders only accept cold hard cash. So we always check how much of that EBIT is translated into free cash flow. During the last three years, Future generated free cash flow amounting to a very robust 92% of its EBIT, more than we'd expect. That puts it in a very strong position to pay down debt.

Our View
On our analysis Future's conversion of EBIT to free cash flow should signal that it won't have too much trouble with its debt. But the other factors we noted above weren't so encouraging. For instance it seems like it has to struggle a bit to grow its EBIT. When we consider all the factors mentioned above, we do feel a bit cautious about Future's use of debt. While debt does have its upside in higher potential returns, we think shareholders should definitely consider how debt levels might make the stock more risky. Above most other metrics, we think its important to track how fast earnings per share is growing, if at all. If you've also come to that realization, you're in luck, because today you can view this interactive graph of Future's earnings per share history for free.
At the end of the day, it's often better to focus on companies that are free from net debt. You can access our special list of such companies (all with a track record of profit growth). It's free.
New: AI Stock Screener & Alerts
Our new AI Stock Screener scans the market every day to uncover opportunities.
• Dividend Powerhouses (3%+ Yield)
• Undervalued Small Caps with Insider Buying
• High growth Tech and AI Companies
Or build your own from over 50 metrics.
Have feedback on this article? Concerned about the content? Get in touch with us directly. Alternatively, email editorial-team (at) simplywallst.com.
This article by Simply Wall St is general in nature. We provide commentary based on historical data and analyst forecasts only using an unbiased methodology and our articles are not intended to be financial advice. It does not constitute a recommendation to buy or sell any stock, and does not take account of your objectives, or your financial situation. We aim to bring you long-term focused analysis driven by fundamental data. Note that our analysis may not factor in the latest price-sensitive company announcements or qualitative material. Simply Wall St has no position in any stocks mentioned.
About LSE:FUTR
Future
Future plc, together with its subsidiaries, publishes and distributes content for technology, gaming, sports, fashion, beauty, homes, wealth, and knowledge sectors in the United States and the United Kingdom.
Undervalued with adequate balance sheet.
Similar Companies
Market Insights

Advertisement
Community Narratives
America Wants Homegrown Drones — Draganfly Is Ready to Deliver
Fair Value US$9.21|28.9% undervalued
JO
Community Contributor
Cheesecake Factory offers an enticing opportunity for long-term growth by leveraging new concepts
Fair Value US$73.83|27.0% undervalued
ZW
Community Contributor
Coca-Cola’s Intrinsic Value Set to Rise with Fed Rate Cut
Fair Value US$67.50|1.9% undervalued
AL
Community Contributor
Fully Permitted Gold Mine with 50 Baggers Potential 
Fair Value CA$41.00|98.5% undervalued
RO
Community Contributor