- United Kingdom
- /
- Insurance
- /
- LSE:SBRE
Sabre Insurance Group's (LON:SBRE) 79% YoY earnings expansion surpassed the shareholder returns over the past year


The simplest way to invest in stocks is to buy exchange traded funds. But you can significantly boost your returns by picking above-average stocks. For example, the Sabre Insurance Group plc (LON:SBRE) share price is up 70% in the last 1 year, clearly besting the market return of around 0.6% (not including dividends). That's a solid performance by our standards! On the other hand, longer term shareholders have had a tougher run, with the stock falling 24% in three years.
The past week has proven to be lucrative for Sabre Insurance Group investors, so let's see if fundamentals drove the company's one-year performance.
Check out our latest analysis for Sabre Insurance Group
There is no denying that markets are sometimes efficient, but prices do not always reflect underlying business performance. By comparing earnings per share (EPS) and share price changes over time, we can get a feel for how investor attitudes to a company have morphed over time.
During the last year Sabre Insurance Group grew its earnings per share (EPS) by 79%. We note that the earnings per share growth isn't far from the share price growth (of 70%). This makes us think the market hasn't really changed its sentiment around the company, in the last year. We don't think its coincidental that the share price is growing at a similar rate to the earnings per share.
You can see below how EPS has changed over time (discover the exact values by clicking on the image).
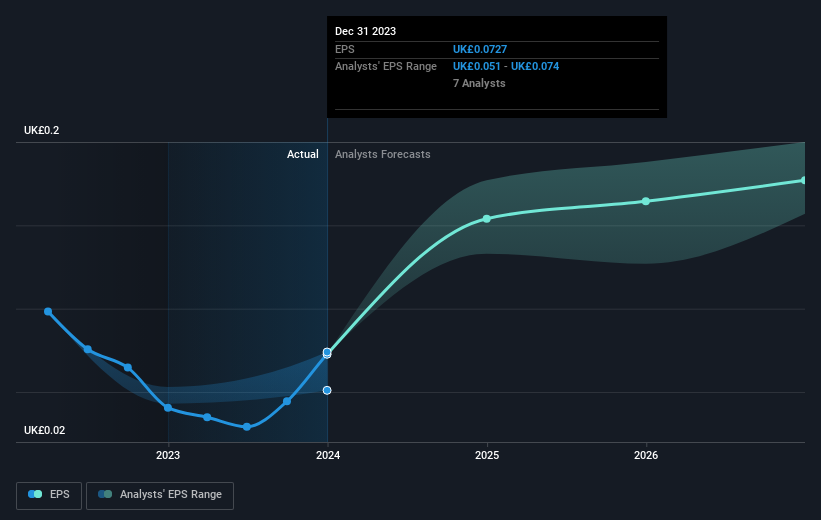
We know that Sabre Insurance Group has improved its bottom line lately, but is it going to grow revenue? This free report showing analyst revenue forecasts should help you figure out if the EPS growth can be sustained.
What About Dividends?
It is important to consider the total shareholder return, as well as the share price return, for any given stock. The TSR incorporates the value of any spin-offs or discounted capital raisings, along with any dividends, based on the assumption that the dividends are reinvested. So for companies that pay a generous dividend, the TSR is often a lot higher than the share price return. We note that for Sabre Insurance Group the TSR over the last 1 year was 73%, which is better than the share price return mentioned above. And there's no prize for guessing that the dividend payments largely explain the divergence!
A Different Perspective
It's nice to see that Sabre Insurance Group shareholders have received a total shareholder return of 73% over the last year. And that does include the dividend. There's no doubt those recent returns are much better than the TSR loss of 4% per year over five years. We generally put more weight on the long term performance over the short term, but the recent improvement could hint at a (positive) inflection point within the business. While it is well worth considering the different impacts that market conditions can have on the share price, there are other factors that are even more important. For example, we've discovered 1 warning sign for Sabre Insurance Group that you should be aware of before investing here.
If you like to buy stocks alongside management, then you might just love this free list of companies. (Hint: insiders have been buying them).
Please note, the market returns quoted in this article reflect the market weighted average returns of stocks that currently trade on British exchanges.
New: Manage All Your Stock Portfolios in One Place
We've created the ultimate portfolio companion for stock investors, and it's free.
• Connect an unlimited number of Portfolios and see your total in one currency
• Be alerted to new Warning Signs or Risks via email or mobile
• Track the Fair Value of your stocks
Have feedback on this article? Concerned about the content? Get in touch with us directly. Alternatively, email editorial-team (at) simplywallst.com.
This article by Simply Wall St is general in nature. We provide commentary based on historical data and analyst forecasts only using an unbiased methodology and our articles are not intended to be financial advice. It does not constitute a recommendation to buy or sell any stock, and does not take account of your objectives, or your financial situation. We aim to bring you long-term focused analysis driven by fundamental data. Note that our analysis may not factor in the latest price-sensitive company announcements or qualitative material. Simply Wall St has no position in any stocks mentioned.
About LSE:SBRE
Sabre Insurance Group
Through its subsidiaries, engages in the writing of general insurance for motor vehicles in the United Kingdom.
Excellent balance sheet and good value.
Market Insights

Community Narratives

