
Advertisement
- United Kingdom
- /
- Beverage
- /
- AIM:CDGP
Market Participants Recognise Chapel Down Group Plc's (LON:CDGP) Revenues Pushing Shares 26% Higher
Despite an already strong run, Chapel Down Group Plc (LON:CDGP) shares have been powering on, with a gain of 26% in the last thirty days. Not all shareholders will be feeling jubilant, since the share price is still down a very disappointing 34% in the last twelve months.
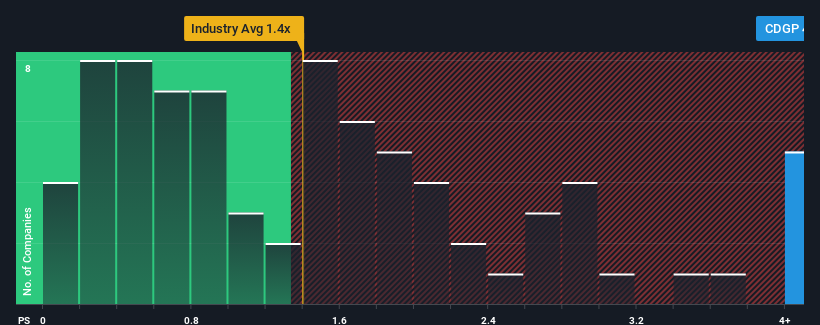
After such a large jump in price, given around half the companies in the United Kingdom's Beverage industry have price-to-sales ratios (or "P/S") below 1.7x, you may consider Chapel Down Group as a stock to avoid entirely with its 4.8x P/S ratio. Although, it's not wise to just take the P/S at face value as there may be an explanation why it's so lofty.
View our latest analysis for Chapel Down Group
How Chapel Down Group Has Been Performing
While the industry has experienced revenue growth lately, Chapel Down Group's revenue has gone into reverse gear, which is not great. It might be that many expect the dour revenue performance to recover substantially, which has kept the P/S from collapsing. However, if this isn't the case, investors might get caught out paying too much for the stock.
If you'd like to see what analysts are forecasting going forward, you should check out our free report on Chapel Down Group.What Are Revenue Growth Metrics Telling Us About The High P/S?
The only time you'd be truly comfortable seeing a P/S as steep as Chapel Down Group's is when the company's growth is on track to outshine the industry decidedly.
Taking a look back first, the company's revenue growth last year wasn't something to get excited about as it posted a disappointing decline of 4.9%. As a result, revenue from three years ago have also fallen 1.7% overall. Accordingly, shareholders would have felt downbeat about the medium-term rates of revenue growth.
Shifting to the future, estimates from the one analyst covering the company suggest revenue should grow by 15% per annum over the next three years. With the industry only predicted to deliver 4.1% each year, the company is positioned for a stronger revenue result.
In light of this, it's understandable that Chapel Down Group's P/S sits above the majority of other companies. Apparently shareholders aren't keen to offload something that is potentially eyeing a more prosperous future.
The Final Word
The strong share price surge has lead to Chapel Down Group's P/S soaring as well. We'd say the price-to-sales ratio's power isn't primarily as a valuation instrument but rather to gauge current investor sentiment and future expectations.
As we suspected, our examination of Chapel Down Group's analyst forecasts revealed that its superior revenue outlook is contributing to its high P/S. It appears that shareholders are confident in the company's future revenues, which is propping up the P/S. Unless the analysts have really missed the mark, these strong revenue forecasts should keep the share price buoyant.
Before you take the next step, you should know about the 1 warning sign for Chapel Down Group that we have uncovered.
If strong companies turning a profit tickle your fancy, then you'll want to check out this free list of interesting companies that trade on a low P/E (but have proven they can grow earnings).
New: AI Stock Screener & Alerts
Our new AI Stock Screener scans the market every day to uncover opportunities.
• Dividend Powerhouses (3%+ Yield)
• Undervalued Small Caps with Insider Buying
• High growth Tech and AI Companies
Or build your own from over 50 metrics.
Have feedback on this article? Concerned about the content? Get in touch with us directly. Alternatively, email editorial-team (at) simplywallst.com.
This article by Simply Wall St is general in nature. We provide commentary based on historical data and analyst forecasts only using an unbiased methodology and our articles are not intended to be financial advice. It does not constitute a recommendation to buy or sell any stock, and does not take account of your objectives, or your financial situation. We aim to bring you long-term focused analysis driven by fundamental data. Note that our analysis may not factor in the latest price-sensitive company announcements or qualitative material. Simply Wall St has no position in any stocks mentioned.
About AIM:CDGP
Chapel Down Group
Through its subsidiaries, engages in the production and sale of alcoholic beverages in the United Kingdom and internationally.
Mediocre balance sheet with very low risk.
Market Insights

Advertisement
Community Narratives
A formidable player in AI and enterprise computing.
Fair Value US$210.00|12.2% overvalued
CO
Community Contributor
IREN's Bold Moves in Sustainable Bitcoin Mining & AI Data Centers
Fair Value US$72.52|17.1% undervalued
BL
Community Contributor
Cooling the Champions: The Aussie Tech Behind F1's Victories
Fair Value AU$12.40|38.7% undervalued
TR
Community Contributor