- United Kingdom
- /
- Energy Services
- /
- LSE:WG.
John Wood Group's(LON:WG.) Share Price Is Down 50% Over The Past Five Years.


Ideally, your overall portfolio should beat the market average. But the main game is to find enough winners to more than offset the losers At this point some shareholders may be questioning their investment in John Wood Group PLC (LON:WG.), since the last five years saw the share price fall 50%. The good news is that the stock is up 4.1% in the last week.
View our latest analysis for John Wood Group
While the efficient markets hypothesis continues to be taught by some, it has been proven that markets are over-reactive dynamic systems, and investors are not always rational. One imperfect but simple way to consider how the market perception of a company has shifted is to compare the change in the earnings per share (EPS) with the share price movement.
John Wood Group became profitable within the last five years. Most would consider that to be a good thing, so it's counter-intuitive to see the share price declining. Other metrics may better explain the share price move.
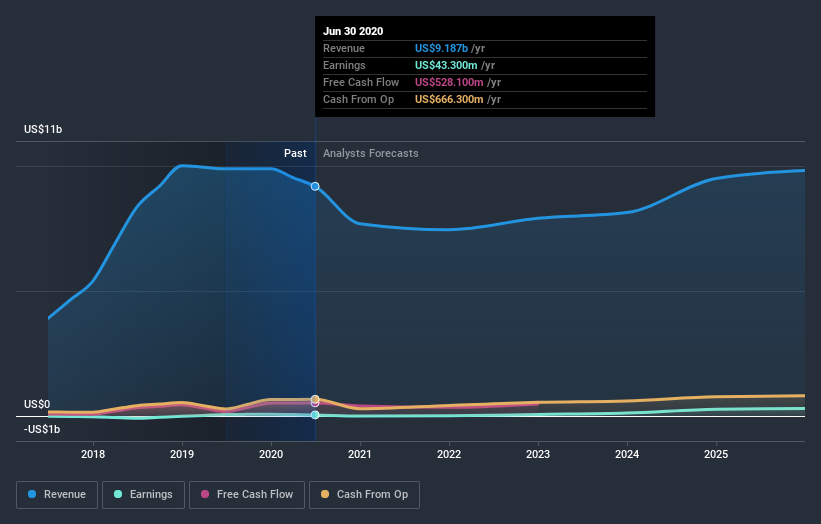
In contrast to the share price, revenue has actually increased by 19% a year in the five year period. A more detailed examination of the revenue and earnings may or may not explain why the share price languishes; there could be an opportunity.
The graphic below depicts how earnings and revenue have changed over time (unveil the exact values by clicking on the image).
John Wood Group is well known by investors, and plenty of clever analysts have tried to predict the future profit levels. Given we have quite a good number of analyst forecasts, it might be well worth checking out this free chart depicting consensus estimates.
What about the Total Shareholder Return (TSR)?
We'd be remiss not to mention the difference between John Wood Group's total shareholder return (TSR) and its share price return. The TSR attempts to capture the value of dividends (as if they were reinvested) as well as any spin-offs or discounted capital raisings offered to shareholders. Dividends have been really beneficial for John Wood Group shareholders, and that cash payout explains why its total shareholder loss of 40%, over the last 5 years, isn't as bad as the share price return.
A Different Perspective
It's nice to see that John Wood Group shareholders have received a total shareholder return of 25% over the last year. Notably the five-year annualised TSR loss of 7% per year compares very unfavourably with the recent share price performance. This makes us a little wary, but the business might have turned around its fortunes. I find it very interesting to look at share price over the long term as a proxy for business performance. But to truly gain insight, we need to consider other information, too. Consider for instance, the ever-present spectre of investment risk. We've identified 2 warning signs with John Wood Group (at least 1 which doesn't sit too well with us) , and understanding them should be part of your investment process.
If you like to buy stocks alongside management, then you might just love this free list of companies. (Hint: insiders have been buying them).
Please note, the market returns quoted in this article reflect the market weighted average returns of stocks that currently trade on GB exchanges.
If you decide to trade John Wood Group, use the lowest-cost* platform that is rated #1 Overall by Barron’s, Interactive Brokers. Trade stocks, options, futures, forex, bonds and funds on 135 markets, all from a single integrated account. Promoted
If you're looking to trade John Wood Group, open an account with the lowest-cost platform trusted by professionals, Interactive Brokers.
With clients in over 200 countries and territories, and access to 160 markets, IBKR lets you trade stocks, options, futures, forex, bonds and funds from a single integrated account.
Enjoy no hidden fees, no account minimums, and FX conversion rates as low as 0.03%, far better than what most brokers offer.
Sponsored ContentNew: Manage All Your Stock Portfolios in One Place
We've created the ultimate portfolio companion for stock investors, and it's free.
• Connect an unlimited number of Portfolios and see your total in one currency
• Be alerted to new Warning Signs or Risks via email or mobile
• Track the Fair Value of your stocks
This article by Simply Wall St is general in nature. It does not constitute a recommendation to buy or sell any stock, and does not take account of your objectives, or your financial situation. We aim to bring you long-term focused analysis driven by fundamental data. Note that our analysis may not factor in the latest price-sensitive company announcements or qualitative material. Simply Wall St has no position in any stocks mentioned.
*Interactive Brokers Rated Lowest Cost Broker by StockBrokers.com Annual Online Review 2020
Have feedback on this article? Concerned about the content? Get in touch with us directly. Alternatively, email editorial-team (at) simplywallst.com.
About LSE:WG.
John Wood Group
Engages in the provision of consulting, project management, and engineering solutions to energy and built environment worldwide.
Undervalued with excellent balance sheet.

