- United Kingdom
- /
- Capital Markets
- /
- AIM:CAV
Cavendish Financial plc's (LON:CAV) Price Is Right But Growth Is Lacking After Shares Rocket 33%


Cavendish Financial plc (LON:CAV) shareholders would be excited to see that the share price has had a great month, posting a 33% gain and recovering from prior weakness. The last 30 days bring the annual gain to a very sharp 28%.
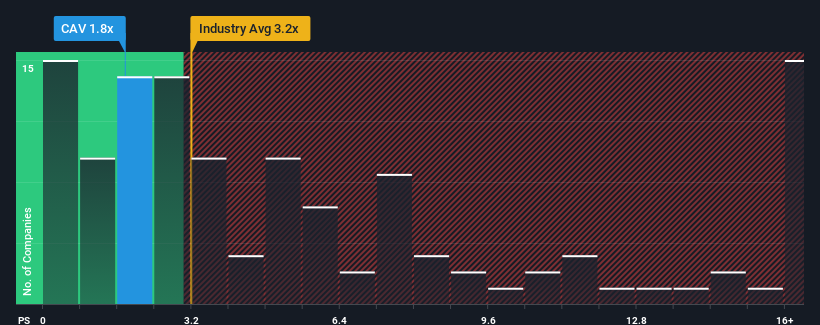
Even after such a large jump in price, Cavendish Financial's price-to-sales (or "P/S") ratio of 1.8x might still make it look like a buy right now compared to the Capital Markets industry in the United Kingdom, where around half of the companies have P/S ratios above 3.2x and even P/S above 9x are quite common. Although, it's not wise to just take the P/S at face value as there may be an explanation why it's limited.
View our latest analysis for Cavendish Financial
How Cavendish Financial Has Been Performing
For example, consider that Cavendish Financial's financial performance has been poor lately as its revenue has been in decline. One possibility is that the P/S is low because investors think the company won't do enough to avoid underperforming the broader industry in the near future. Those who are bullish on Cavendish Financial will be hoping that this isn't the case so that they can pick up the stock at a lower valuation.
Although there are no analyst estimates available for Cavendish Financial, take a look at this free data-rich visualisation to see how the company stacks up on earnings, revenue and cash flow.Is There Any Revenue Growth Forecasted For Cavendish Financial?
There's an inherent assumption that a company should underperform the industry for P/S ratios like Cavendish Financial's to be considered reasonable.
In reviewing the last year of financials, we were disheartened to see the company's revenues fell to the tune of 20%. As a result, revenue from three years ago have also fallen 11% overall. Accordingly, shareholders would have felt downbeat about the medium-term rates of revenue growth.
Weighing that medium-term revenue trajectory against the broader industry's one-year forecast for expansion of 6.8% shows it's an unpleasant look.
With this information, we are not surprised that Cavendish Financial is trading at a P/S lower than the industry. However, we think shrinking revenues are unlikely to lead to a stable P/S over the longer term, which could set up shareholders for future disappointment. There's potential for the P/S to fall to even lower levels if the company doesn't improve its top-line growth.
What Does Cavendish Financial's P/S Mean For Investors?
The latest share price surge wasn't enough to lift Cavendish Financial's P/S close to the industry median. Generally, our preference is to limit the use of the price-to-sales ratio to establishing what the market thinks about the overall health of a company.
It's no surprise that Cavendish Financial maintains its low P/S off the back of its sliding revenue over the medium-term. At this stage investors feel the potential for an improvement in revenue isn't great enough to justify a higher P/S ratio. If recent medium-term revenue trends continue, it's hard to see the share price moving strongly in either direction in the near future under these circumstances.
Having said that, be aware Cavendish Financial is showing 4 warning signs in our investment analysis, and 3 of those are concerning.
If companies with solid past earnings growth is up your alley, you may wish to see this free collection of other companies with strong earnings growth and low P/E ratios.
New: AI Stock Screener & Alerts
Our new AI Stock Screener scans the market every day to uncover opportunities.
• Dividend Powerhouses (3%+ Yield)
• Undervalued Small Caps with Insider Buying
• High growth Tech and AI Companies
Or build your own from over 50 metrics.
Have feedback on this article? Concerned about the content? Get in touch with us directly. Alternatively, email editorial-team (at) simplywallst.com.
This article by Simply Wall St is general in nature. We provide commentary based on historical data and analyst forecasts only using an unbiased methodology and our articles are not intended to be financial advice. It does not constitute a recommendation to buy or sell any stock, and does not take account of your objectives, or your financial situation. We aim to bring you long-term focused analysis driven by fundamental data. Note that our analysis may not factor in the latest price-sensitive company announcements or qualitative material. Simply Wall St has no position in any stocks mentioned.
About AIM:CAV
Cavendish Financial
Operates as an investment bank in the United Kingdom.
Adequate balance sheet slight.
