
Advertisement
- United Kingdom
- /
- Hospitality
- /
- LSE:GYM
Why Investors Shouldn't Be Surprised By The Gym Group plc's (LON:GYM) 25% Share Price Surge
The Gym Group plc (LON:GYM) shareholders would be excited to see that the share price has had a great month, posting a 25% gain and recovering from prior weakness. Looking back a bit further, it's encouraging to see the stock is up 31% in the last year.
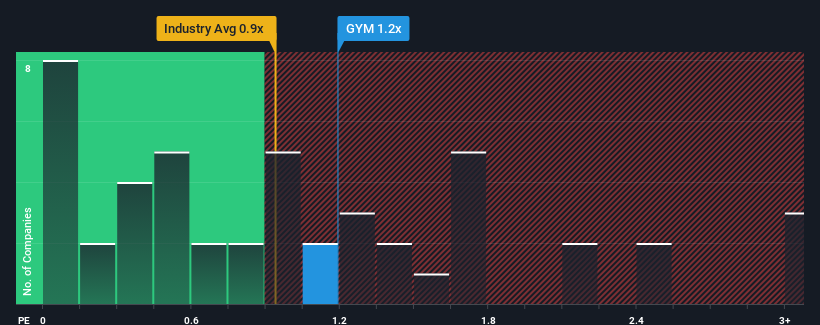
Although its price has surged higher, it's still not a stretch to say that Gym Group's price-to-sales (or "P/S") ratio of 1.2x right now seems quite "middle-of-the-road" compared to the Hospitality industry in the United Kingdom, where the median P/S ratio is around 0.9x. While this might not raise any eyebrows, if the P/S ratio is not justified investors could be missing out on a potential opportunity or ignoring looming disappointment.
We've discovered 2 warning signs about Gym Group. View them for free.View our latest analysis for Gym Group
How Has Gym Group Performed Recently?
Recent revenue growth for Gym Group has been in line with the industry. The P/S ratio is probably moderate because investors think this modest revenue performance will continue. If this is the case, then at least existing shareholders won't be losing sleep over the current share price.
Keen to find out how analysts think Gym Group's future stacks up against the industry? In that case, our free report is a great place to start.Is There Some Revenue Growth Forecasted For Gym Group?
Gym Group's P/S ratio would be typical for a company that's only expected to deliver moderate growth, and importantly, perform in line with the industry.
Taking a look back first, we see that the company managed to grow revenues by a handy 11% last year. This was backed up an excellent period prior to see revenue up by 113% in total over the last three years. Accordingly, shareholders would have definitely welcomed those medium-term rates of revenue growth.
Turning to the outlook, the next three years should generate growth of 8.8% per annum as estimated by the nine analysts watching the company. Meanwhile, the rest of the industry is forecast to expand by 7.3% per year, which is not materially different.
With this in mind, it makes sense that Gym Group's P/S is closely matching its industry peers. Apparently shareholders are comfortable to simply hold on while the company is keeping a low profile.
What We Can Learn From Gym Group's P/S?
Gym Group's stock has a lot of momentum behind it lately, which has brought its P/S level with the rest of the industry. It's argued the price-to-sales ratio is an inferior measure of value within certain industries, but it can be a powerful business sentiment indicator.
A Gym Group's P/S seems about right to us given the knowledge that analysts are forecasting a revenue outlook that is similar to the Hospitality industry. At this stage investors feel the potential for an improvement or deterioration in revenue isn't great enough to push P/S in a higher or lower direction. Unless these conditions change, they will continue to support the share price at these levels.
Plus, you should also learn about these 2 warning signs we've spotted with Gym Group (including 1 which makes us a bit uncomfortable).
If these risks are making you reconsider your opinion on Gym Group, explore our interactive list of high quality stocks to get an idea of what else is out there.
New: Manage All Your Stock Portfolios in One Place
We've created the ultimate portfolio companion for stock investors, and it's free.
• Connect an unlimited number of Portfolios and see your total in one currency
• Be alerted to new Warning Signs or Risks via email or mobile
• Track the Fair Value of your stocks
Have feedback on this article? Concerned about the content? Get in touch with us directly. Alternatively, email editorial-team (at) simplywallst.com.
This article by Simply Wall St is general in nature. We provide commentary based on historical data and analyst forecasts only using an unbiased methodology and our articles are not intended to be financial advice. It does not constitute a recommendation to buy or sell any stock, and does not take account of your objectives, or your financial situation. We aim to bring you long-term focused analysis driven by fundamental data. Note that our analysis may not factor in the latest price-sensitive company announcements or qualitative material. Simply Wall St has no position in any stocks mentioned.
About LSE:GYM
Gym Group
Operates a network of gym facilities under the Gym Group brand name in the United Kingdom.
Reasonable growth potential and fair value.
Similar Companies
Market Insights

Advertisement
Community Narratives
MicroVision will explode future revenue by 380.37% with a vision towards success
Fair Value US$60.00|98.4% undervalued
TH
Community Contributor
The Indispensable Artery for a New North American Economy
Fair Value CA$132.87|1.3% undervalued
TI
Community Contributor