
Advertisement
- United Kingdom
- /
- Food and Staples Retail
- /
- LSE:TSCO
Investors in Tesco (LON:TSCO) have seen solid returns of 115% over the past three years
One simple way to benefit from the stock market is to buy an index fund. But if you buy good businesses at attractive prices, your portfolio returns could exceed the average market return. For example, the Tesco PLC (LON:TSCO) share price is up 90% in the last three years, clearly besting the market return of around 24% (not including dividends). On the other hand, the returns haven't been quite so good recently, with shareholders up just 23%, including dividends.
So let's investigate and see if the longer term performance of the company has been in line with the underlying business' progress.
To paraphrase Benjamin Graham: Over the short term the market is a voting machine, but over the long term it's a weighing machine. One way to examine how market sentiment has changed over time is to look at the interaction between a company's share price and its earnings per share (EPS).
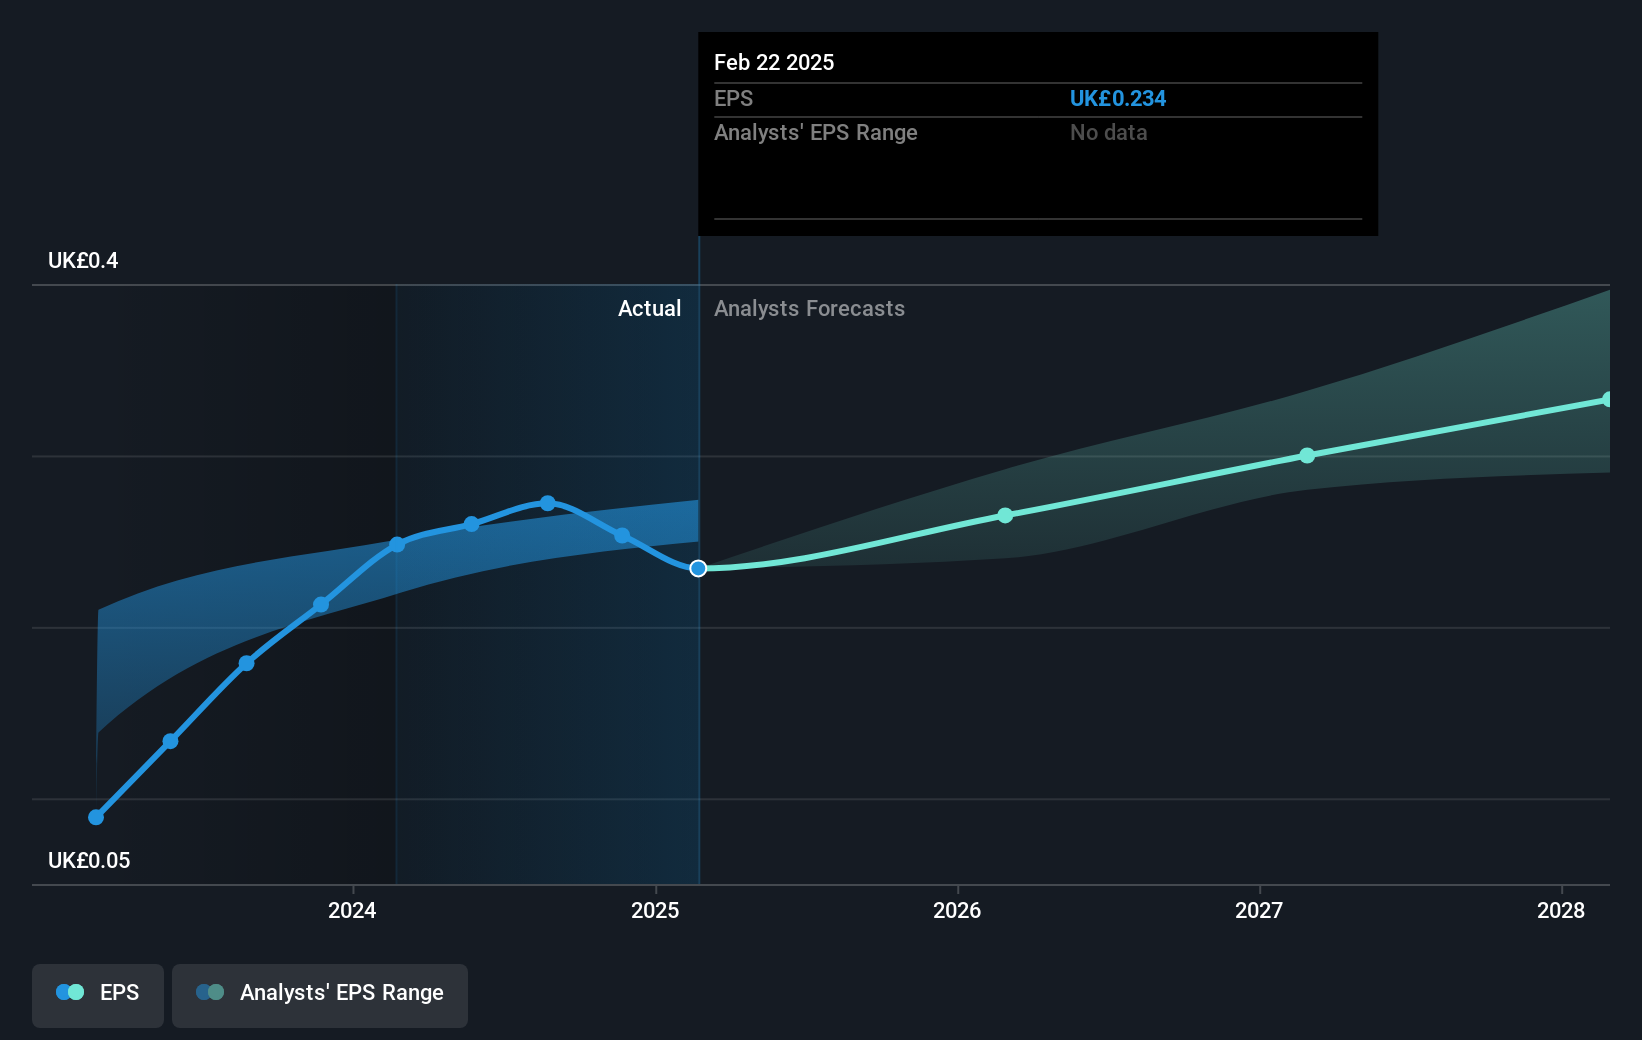
Tesco was able to grow its EPS at 7.5% per year over three years, sending the share price higher. This EPS growth is lower than the 24% average annual increase in the share price. This indicates that the market is feeling more optimistic on the stock, after the last few years of progress. That's not necessarily surprising considering the three-year track record of earnings growth.
You can see how EPS has changed over time in the image below (click on the chart to see the exact values).
We consider it positive that insiders have made significant purchases in the last year. Having said that, most people consider earnings and revenue growth trends to be a more meaningful guide to the business. This free interactive report on Tesco's earnings, revenue and cash flow is a great place to start, if you want to investigate the stock further.
What About Dividends?
As well as measuring the share price return, investors should also consider the total shareholder return (TSR). Whereas the share price return only reflects the change in the share price, the TSR includes the value of dividends (assuming they were reinvested) and the benefit of any discounted capital raising or spin-off. Arguably, the TSR gives a more comprehensive picture of the return generated by a stock. In the case of Tesco, it has a TSR of 115% for the last 3 years. That exceeds its share price return that we previously mentioned. And there's no prize for guessing that the dividend payments largely explain the divergence!
A Different Perspective
It's nice to see that Tesco shareholders have received a total shareholder return of 23% over the last year. That's including the dividend. That's better than the annualised return of 19% over half a decade, implying that the company is doing better recently. Someone with an optimistic perspective could view the recent improvement in TSR as indicating that the business itself is getting better with time. While it is well worth considering the different impacts that market conditions can have on the share price, there are other factors that are even more important. For example, we've discovered 1 warning sign for Tesco that you should be aware of before investing here.
Tesco is not the only stock that insiders are buying. For those who like to find lesser know companies this free list of growing companies with recent insider purchasing, could be just the ticket.
Please note, the market returns quoted in this article reflect the market weighted average returns of stocks that currently trade on British exchanges.
Valuation is complex, but we're here to simplify it.
Discover if Tesco might be undervalued or overvalued with our detailed analysis, featuring fair value estimates, potential risks, dividends, insider trades, and its financial condition.
Access Free AnalysisHave feedback on this article? Concerned about the content? Get in touch with us directly. Alternatively, email editorial-team (at) simplywallst.com.
This article by Simply Wall St is general in nature. We provide commentary based on historical data and analyst forecasts only using an unbiased methodology and our articles are not intended to be financial advice. It does not constitute a recommendation to buy or sell any stock, and does not take account of your objectives, or your financial situation. We aim to bring you long-term focused analysis driven by fundamental data. Note that our analysis may not factor in the latest price-sensitive company announcements or qualitative material. Simply Wall St has no position in any stocks mentioned.
About LSE:TSCO
Tesco
Operates as a grocery retailer in the United Kingdom, Republic of Ireland, the Czech Republic, Slovakia, and Hungary.
Adequate balance sheet and fair value.
Similar Companies
Market Insights

Advertisement
Community Narratives
Quality at a Premium. A time to watch, not to buy?
Fair Value US$154.56|30.1% undervalued
DA
Community Contributor
GRAB: The Super-App at the Heart of Southeast Asia’s Digital Boom
Fair Value US$8.20|25.6% undervalued
BL
Community Contributor
Verve Group to Surge with 51.61% Revenue Growth
Fair Value €6.00|63.2% undervalued
ME
Community Contributor