- United Kingdom
- /
- Professional Services
- /
- AIM:INCE
Here's Why Ince Group (LON:INCE) Has A Meaningful Debt Burden


Legendary fund manager Li Lu (who Charlie Munger backed) once said, 'The biggest investment risk is not the volatility of prices, but whether you will suffer a permanent loss of capital.' It's only natural to consider a company's balance sheet when you examine how risky it is, since debt is often involved when a business collapses. Importantly, The Ince Group plc (LON:INCE) does carry debt. But is this debt a concern to shareholders?
Why Does Debt Bring Risk?
Debt is a tool to help businesses grow, but if a business is incapable of paying off its lenders, then it exists at their mercy. If things get really bad, the lenders can take control of the business. However, a more usual (but still expensive) situation is where a company must dilute shareholders at a cheap share price simply to get debt under control. Of course, the upside of debt is that it often represents cheap capital, especially when it replaces dilution in a company with the ability to reinvest at high rates of return. When we think about a company's use of debt, we first look at cash and debt together.
Check out our latest analysis for Ince Group
How Much Debt Does Ince Group Carry?
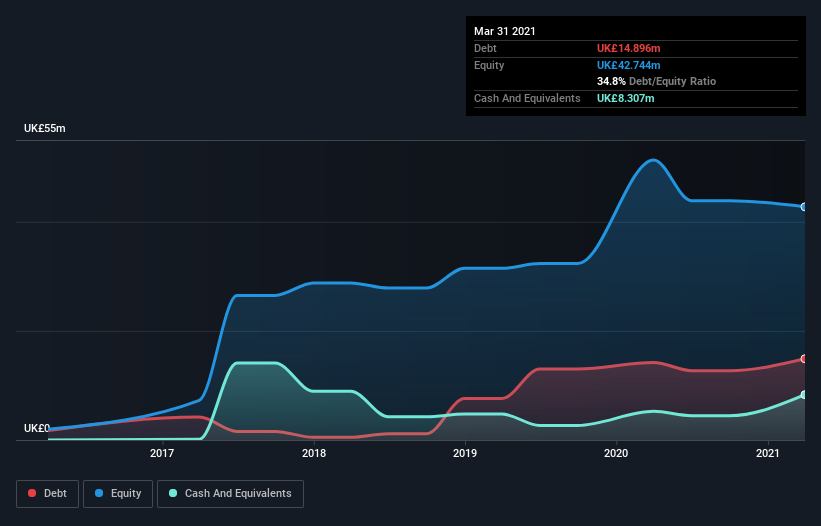
You can click the graphic below for the historical numbers, but it shows that as of March 2021 Ince Group had UK£14.9m of debt, an increase on UK£14.2m, over one year. However, it also had UK£8.31m in cash, and so its net debt is UK£6.59m.
How Healthy Is Ince Group's Balance Sheet?
According to the last reported balance sheet, Ince Group had liabilities of UK£66.9m due within 12 months, and liabilities of UK£37.8m due beyond 12 months. Offsetting these obligations, it had cash of UK£8.31m as well as receivables valued at UK£42.6m due within 12 months. So its liabilities outweigh the sum of its cash and (near-term) receivables by UK£53.8m.
When you consider that this deficiency exceeds the company's UK£47.0m market capitalization, you might well be inclined to review the balance sheet intently. Hypothetically, extremely heavy dilution would be required if the company were forced to pay down its liabilities by raising capital at the current share price.
We measure a company's debt load relative to its earnings power by looking at its net debt divided by its earnings before interest, tax, depreciation, and amortization (EBITDA) and by calculating how easily its earnings before interest and tax (EBIT) cover its interest expense (interest cover). This way, we consider both the absolute quantum of the debt, as well as the interest rates paid on it.
With net debt sitting at just 0.48 times EBITDA, Ince Group is arguably pretty conservatively geared. And it boasts interest cover of 9.9 times, which is more than adequate. In fact Ince Group's saving grace is its low debt levels, because its EBIT has tanked 65% in the last twelve months. When a company sees its earnings tank, it can sometimes find its relationships with its lenders turn sour. The balance sheet is clearly the area to focus on when you are analysing debt. But ultimately the future profitability of the business will decide if Ince Group can strengthen its balance sheet over time. So if you want to see what the professionals think, you might find this free report on analyst profit forecasts to be interesting.
But our final consideration is also important, because a company cannot pay debt with paper profits; it needs cold hard cash. So we clearly need to look at whether that EBIT is leading to corresponding free cash flow. Over the most recent three years, Ince Group recorded free cash flow worth 72% of its EBIT, which is around normal, given free cash flow excludes interest and tax. This free cash flow puts the company in a good position to pay down debt, when appropriate.
Our View
Ince Group's EBIT growth rate was a real negative on this analysis, although the other factors we considered cast it in a significantly better light. In particular, its conversion of EBIT to free cash flow was re-invigorating. Taking the abovementioned factors together we do think Ince Group's debt poses some risks to the business. While that debt can boost returns, we think the company has enough leverage now. The balance sheet is clearly the area to focus on when you are analysing debt. But ultimately, every company can contain risks that exist outside of the balance sheet. These risks can be hard to spot. Every company has them, and we've spotted 5 warning signs for Ince Group (of which 1 is a bit unpleasant!) you should know about.
When all is said and done, sometimes its easier to focus on companies that don't even need debt. Readers can access a list of growth stocks with zero net debt 100% free, right now.
If you’re looking to trade Ince Group, open an account with the lowest-cost* platform trusted by professionals, Interactive Brokers. Their clients from over 200 countries and territories trade stocks, options, futures, forex, bonds and funds worldwide from a single integrated account. Promoted
If you're looking to trade Ince Group, open an account with the lowest-cost platform trusted by professionals, Interactive Brokers.
With clients in over 200 countries and territories, and access to 160 markets, IBKR lets you trade stocks, options, futures, forex, bonds and funds from a single integrated account.
Enjoy no hidden fees, no account minimums, and FX conversion rates as low as 0.03%, far better than what most brokers offer.
Sponsored ContentNew: AI Stock Screener & Alerts
Our new AI Stock Screener scans the market every day to uncover opportunities.
• Dividend Powerhouses (3%+ Yield)
• Undervalued Small Caps with Insider Buying
• High growth Tech and AI Companies
Or build your own from over 50 metrics.
This article by Simply Wall St is general in nature. It does not constitute a recommendation to buy or sell any stock, and does not take account of your objectives, or your financial situation. We aim to bring you long-term focused analysis driven by fundamental data. Note that our analysis may not factor in the latest price-sensitive company announcements or qualitative material. Simply Wall St has no position in any stocks mentioned.
*Interactive Brokers Rated Lowest Cost Broker by StockBrokers.com Annual Online Review 2020
Have feedback on this article? Concerned about the content? Get in touch with us directly. Alternatively, email editorial-team (at) simplywallst.com.
About AIM:INCE
Ince Group
The Ince Group plc, together with its subsidiaries, provides legal and professional services in the United Kingdom, Europe, the Middle East, and Asia.
Slightly overvalued unattractive dividend payer.
Market Insights

Community Narratives


