- United Kingdom
- /
- Professional Services
- /
- AIM:INCE
Does Ince Group's (LON:INCE) Statutory Profit Adequately Reflect Its Underlying Profit?


Many investors consider it preferable to invest in profitable companies over unprofitable ones, because profitability suggests a business is sustainable. Having said that, sometimes statutory profit levels are not a good guide to ongoing profitability, because some short term one-off factor has impacted profit levels. This article will consider whether Ince Group's (LON:INCE) statutory profits are a good guide to its underlying earnings.
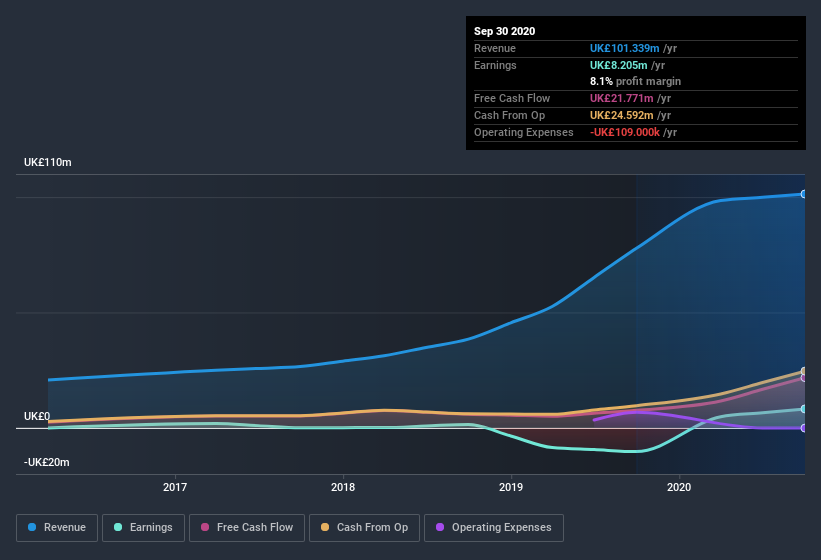
It's good to see that over the last twelve months Ince Group made a profit of UK£8.21m on revenue of UK£101.3m.
Check out our latest analysis for Ince Group
Importantly, statutory profits are not always the best tool for understanding a company's true earnings power, so it's well worth examining profits in a little more detail. So today we'll examine what Ince Group's cashflow and its expanding share count tell us about the nature of its profits. That might leave you wondering what analysts are forecasting in terms of future profitability. Luckily, you can click here to see an interactive graph depicting future profitability, based on their estimates.
A Closer Look At Ince Group's Earnings
One key financial ratio used to measure how well a company converts its profit to free cash flow (FCF) is the accrual ratio. To get the accrual ratio we first subtract FCF from profit for a period, and then divide that number by the average operating assets for the period. You could think of the accrual ratio from cashflow as the 'non-FCF profit ratio'.
As a result, a negative accrual ratio is a positive for the company, and a positive accrual ratio is a negative. While having an accrual ratio above zero is of little concern, we do think it's worth noting when a company has a relatively high accrual ratio. That's because some academic studies have suggested that high accruals ratios tend to lead to lower profit or less profit growth.
Over the twelve months to September 2020, Ince Group recorded an accrual ratio of -0.29. Therefore, its statutory earnings were very significantly less than its free cashflow. In fact, it had free cash flow of UK£22m in the last year, which was a lot more than its statutory profit of UK£8.21m. Ince Group's free cash flow improved over the last year, which is generally good to see. Unfortunately for shareholders, the company has also been issuing new shares, diluting their share of future earnings.
To understand the value of a company's earnings growth, it is imperative to consider any dilution of shareholders' interests. In fact, Ince Group increased the number of shares on issue by 84% over the last twelve months by issuing new shares. As a result, its net income is now split between a greater number of shares. To celebrate net income while ignoring dilution is like rejoicing because you have a single slice of a larger pizza, but ignoring the fact that the pizza is now cut into many more slices. You can see a chart of Ince Group's EPS by clicking here.
A Look At The Impact Of Ince Group's Dilution on Its Earnings Per Share (EPS).
As it happens, we don't know how much the company made or lost three years ago, because we don't have the data. And even focusing only on the last twelve months, we don't have a meaningful growth rate because it made a loss a year ago, too. But mathematics aside, it is always good to see when a formerly unprofitable business come good (though we accept profit would have been higher if dilution had not been required). And so, you can see quite clearly that dilution is having a rather significant impact on shareholders.
In the long term, if Ince Group's earnings per share can increase, then the share price should too. However, if its profit increases while its earnings per share stay flat (or even fall) then shareholders might not see much benefit. For that reason, you could say that EPS is more important that net income in the long run, assuming the goal is to assess whether a company's share price might grow.
Our Take On Ince Group's Profit Performance
In conclusion, Ince Group has a strong cashflow relative to earnings, which indicates good quality earnings, but the dilution means its earnings per share are dropping faster than its profit. Given the contrasting considerations, we don't have a strong view as to whether Ince Group's profits are an apt reflection of its underlying potential for profit. If you'd like to know more about Ince Group as a business, it's important to be aware of any risks it's facing. Be aware that Ince Group is showing 3 warning signs in our investment analysis and 1 of those doesn't sit too well with us...
Our examination of Ince Group has focussed on certain factors that can make its earnings look better than they are. But there are plenty of other ways to inform your opinion of a company. For example, many people consider a high return on equity as an indication of favorable business economics, while others like to 'follow the money' and search out stocks that insiders are buying. So you may wish to see this free collection of companies boasting high return on equity, or this list of stocks that insiders are buying.
If you decide to trade Ince Group, use the lowest-cost* platform that is rated #1 Overall by Barron’s, Interactive Brokers. Trade stocks, options, futures, forex, bonds and funds on 135 markets, all from a single integrated account. Promoted
If you're looking to trade Ince Group, open an account with the lowest-cost platform trusted by professionals, Interactive Brokers.
With clients in over 200 countries and territories, and access to 160 markets, IBKR lets you trade stocks, options, futures, forex, bonds and funds from a single integrated account.
Enjoy no hidden fees, no account minimums, and FX conversion rates as low as 0.03%, far better than what most brokers offer.
Sponsored ContentNew: AI Stock Screener & Alerts
Our new AI Stock Screener scans the market every day to uncover opportunities.
• Dividend Powerhouses (3%+ Yield)
• Undervalued Small Caps with Insider Buying
• High growth Tech and AI Companies
Or build your own from over 50 metrics.
This article by Simply Wall St is general in nature. It does not constitute a recommendation to buy or sell any stock, and does not take account of your objectives, or your financial situation. We aim to bring you long-term focused analysis driven by fundamental data. Note that our analysis may not factor in the latest price-sensitive company announcements or qualitative material. Simply Wall St has no position in any stocks mentioned.
*Interactive Brokers Rated Lowest Cost Broker by StockBrokers.com Annual Online Review 2020
Have feedback on this article? Concerned about the content? Get in touch with us directly. Alternatively, email editorial-team (at) simplywallst.com.
About AIM:INCE
Ince Group
The Ince Group plc, together with its subsidiaries, provides legal and professional services in the United Kingdom, Europe, the Middle East, and Asia.
Slightly overvalued unattractive dividend payer.
Market Insights

Community Narratives


