
Advertisement

Some say volatility, rather than debt, is the best way to think about risk as an investor, but Warren Buffett famously said that 'Volatility is far from synonymous with risk.' It's only natural to consider a company's balance sheet when you examine how risky it is, since debt is often involved when a business collapses. We note that IMI plc (LON:IMI) does have debt on its balance sheet. But is this debt a concern to shareholders?
Why Does Debt Bring Risk?
Debt assists a business until the business has trouble paying it off, either with new capital or with free cash flow. If things get really bad, the lenders can take control of the business. However, a more usual (but still expensive) situation is where a company must dilute shareholders at a cheap share price simply to get debt under control. Of course, debt can be an important tool in businesses, particularly capital heavy businesses. When we think about a company's use of debt, we first look at cash and debt together.
See our latest analysis for IMI
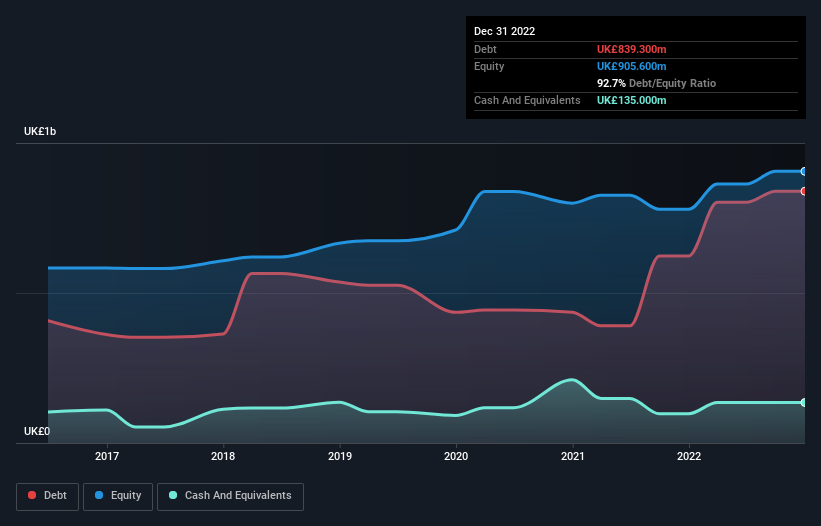
How Much Debt Does IMI Carry?
As you can see below, at the end of December 2022, IMI had UK£839.3m of debt, up from UK£623.5m a year ago. Click the image for more detail. On the flip side, it has UK£135.0m in cash leading to net debt of about UK£704.3m.
How Strong Is IMI's Balance Sheet?
According to the last reported balance sheet, IMI had liabilities of UK£818.5m due within 12 months, and liabilities of UK£795.8m due beyond 12 months. Offsetting these obligations, it had cash of UK£135.0m as well as receivables valued at UK£463.3m due within 12 months. So it has liabilities totalling UK£1.02b more than its cash and near-term receivables, combined.
While this might seem like a lot, it is not so bad since IMI has a market capitalization of UK£4.28b, and so it could probably strengthen its balance sheet by raising capital if it needed to. However, it is still worthwhile taking a close look at its ability to pay off debt.
In order to size up a company's debt relative to its earnings, we calculate its net debt divided by its earnings before interest, tax, depreciation, and amortization (EBITDA) and its earnings before interest and tax (EBIT) divided by its interest expense (its interest cover). This way, we consider both the absolute quantum of the debt, as well as the interest rates paid on it.
We'd say that IMI's moderate net debt to EBITDA ratio ( being 1.8), indicates prudence when it comes to debt. And its commanding EBIT of 17.2 times its interest expense, implies the debt load is as light as a peacock feather. One way IMI could vanquish its debt would be if it stops borrowing more but continues to grow EBIT at around 12%, as it did over the last year. The balance sheet is clearly the area to focus on when you are analysing debt. But ultimately the future profitability of the business will decide if IMI can strengthen its balance sheet over time. So if you want to see what the professionals think, you might find this free report on analyst profit forecasts to be interesting.
Finally, a business needs free cash flow to pay off debt; accounting profits just don't cut it. So it's worth checking how much of that EBIT is backed by free cash flow. Over the most recent three years, IMI recorded free cash flow worth 79% of its EBIT, which is around normal, given free cash flow excludes interest and tax. This cold hard cash means it can reduce its debt when it wants to.
Our View
IMI's interest cover suggests it can handle its debt as easily as Cristiano Ronaldo could score a goal against an under 14's goalkeeper. And that's just the beginning of the good news since its conversion of EBIT to free cash flow is also very heartening. Zooming out, IMI seems to use debt quite reasonably; and that gets the nod from us. While debt does bring risk, when used wisely it can also bring a higher return on equity. When analysing debt levels, the balance sheet is the obvious place to start. However, not all investment risk resides within the balance sheet - far from it. Case in point: We've spotted 1 warning sign for IMI you should be aware of.
Of course, if you're the type of investor who prefers buying stocks without the burden of debt, then don't hesitate to discover our exclusive list of net cash growth stocks, today.
New: AI Stock Screener & Alerts
Our new AI Stock Screener scans the market every day to uncover opportunities.
• Dividend Powerhouses (3%+ Yield)
• Undervalued Small Caps with Insider Buying
• High growth Tech and AI Companies
Or build your own from over 50 metrics.
Have feedback on this article? Concerned about the content? Get in touch with us directly. Alternatively, email editorial-team (at) simplywallst.com.
This article by Simply Wall St is general in nature. We provide commentary based on historical data and analyst forecasts only using an unbiased methodology and our articles are not intended to be financial advice. It does not constitute a recommendation to buy or sell any stock, and does not take account of your objectives, or your financial situation. We aim to bring you long-term focused analysis driven by fundamental data. Note that our analysis may not factor in the latest price-sensitive company announcements or qualitative material. Simply Wall St has no position in any stocks mentioned.
About LSE:IMI
IMI
An engineering company, designs, manufactures, and services engineering products in the United Kingdom, Germany, rest of Europe, the United States, rest of the Americas, China, rest of the Asia Pacific, the Middle East, and Africa.
Solid track record with excellent balance sheet.
Similar Companies
Market Insights

Advertisement
Community Narratives
Scaling up in building materials with smart M&A and growing profitability
Fair Value US$2.77|28.9% undervalued
CM
Community Contributor
Hims: The Platform Powering Personalised Healthcare
Fair Value US$114.01|46.3% undervalued
BL
Community Contributor
Undervalued lottery company with strong fundamentals
Fair Value AU$15.00|33.9% undervalued
RO
Community Contributor
Proximus, transferring money from the impatient to the patient investor
Fair Value €16.62|56.1% undervalued
AX
Community Contributor