
Advertisement
- United Kingdom
- /
- Trade Distributors
- /
- LSE:HWDN
Howden Joinery Group (LON:HWDN) shareholders have earned a 11% CAGR over the last five years

Generally speaking the aim of active stock picking is to find companies that provide returns that are superior to the market average. Buying under-rated businesses is one path to excess returns. For example, the Howden Joinery Group Plc (LON:HWDN) share price is up 50% in the last 5 years, clearly besting the market return of around 24% (ignoring dividends).
So let's assess the underlying fundamentals over the last 5 years and see if they've moved in lock-step with shareholder returns.
There is no denying that markets are sometimes efficient, but prices do not always reflect underlying business performance. One flawed but reasonable way to assess how sentiment around a company has changed is to compare the earnings per share (EPS) with the share price.
During five years of share price growth, Howden Joinery Group achieved compound earnings per share (EPS) growth of 5.5% per year. This EPS growth is slower than the share price growth of 8% per year, over the same period. So it's fair to assume the market has a higher opinion of the business than it did five years ago. And that's hardly shocking given the track record of growth.
You can see below how EPS has changed over time (discover the exact values by clicking on the image).
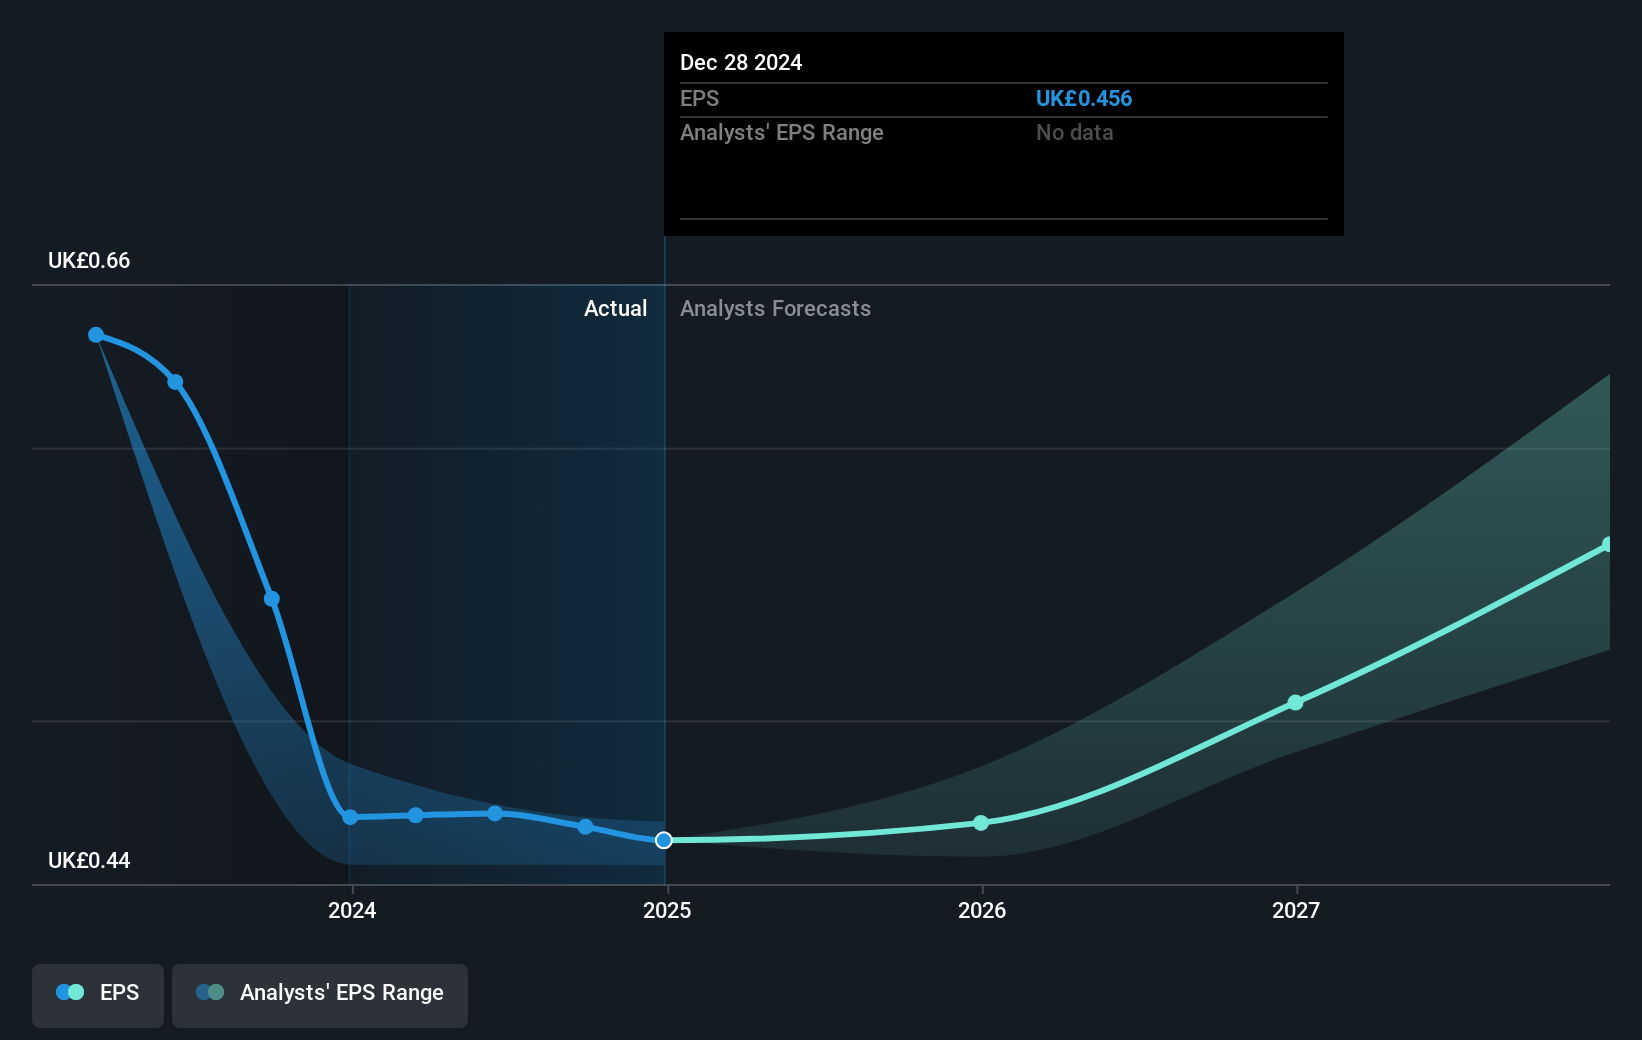
We like that insiders have been buying shares in the last twelve months. Even so, future earnings will be far more important to whether current shareholders make money. Before buying or selling a stock, we always recommend a close examination of historic growth trends, available here..
What About Dividends?
When looking at investment returns, it is important to consider the difference between total shareholder return (TSR) and share price return. The TSR incorporates the value of any spin-offs or discounted capital raisings, along with any dividends, based on the assumption that the dividends are reinvested. So for companies that pay a generous dividend, the TSR is often a lot higher than the share price return. We note that for Howden Joinery Group the TSR over the last 5 years was 72%, which is better than the share price return mentioned above. This is largely a result of its dividend payments!
A Different Perspective
Howden Joinery Group shareholders are down 1.6% for the year (even including dividends), but the market itself is up 8.0%. Even the share prices of good stocks drop sometimes, but we want to see improvements in the fundamental metrics of a business, before getting too interested. Longer term investors wouldn't be so upset, since they would have made 11%, each year, over five years. If the fundamental data continues to indicate long term sustainable growth, the current sell-off could be an opportunity worth considering. I find it very interesting to look at share price over the long term as a proxy for business performance. But to truly gain insight, we need to consider other information, too. Case in point: We've spotted 2 warning signs for Howden Joinery Group you should be aware of.
There are plenty of other companies that have insiders buying up shares. You probably do not want to miss this free list of undervalued small cap companies that insiders are buying.
Please note, the market returns quoted in this article reflect the market weighted average returns of stocks that currently trade on British exchanges.
Valuation is complex, but we're here to simplify it.
Discover if Howden Joinery Group might be undervalued or overvalued with our detailed analysis, featuring fair value estimates, potential risks, dividends, insider trades, and its financial condition.
Access Free AnalysisHave feedback on this article? Concerned about the content? Get in touch with us directly. Alternatively, email editorial-team (at) simplywallst.com.
This article by Simply Wall St is general in nature. We provide commentary based on historical data and analyst forecasts only using an unbiased methodology and our articles are not intended to be financial advice. It does not constitute a recommendation to buy or sell any stock, and does not take account of your objectives, or your financial situation. We aim to bring you long-term focused analysis driven by fundamental data. Note that our analysis may not factor in the latest price-sensitive company announcements or qualitative material. Simply Wall St has no position in any stocks mentioned.
About LSE:HWDN
Howden Joinery Group
Supplies various kitchen, joinery, and hardware products in the United Kingdom, France, Belgium, and the Republic of Ireland.
Flawless balance sheet average dividend payer.
Market Insights


Advertisement
Community Narratives
The Future of Drug Testing? Fingerprint Tech Shows Serious Promise
Fair Value US$2.98|40.3% undervalued
JO
Community Contributor
Suncorp’s Next Chapter: Insurance-Only and Ready to Grow
Fair Value AU$22.83|7.9% undervalued
RO
Community Contributor
Thyssenkrupp Nucera Will Achieve Double-Digit Profits by 2030 Boosted by Hydrogen Growth
Fair Value €14.40|31.6% undervalued
CH
Community Contributor
Tesla’s Nvidia Moment – The AI & Robotics Inflection Point
Fair Value US$359.72|12.3% undervalued
BL
Community Contributor