- United Kingdom
- /
- Aerospace & Defense
- /
- LSE:BAB
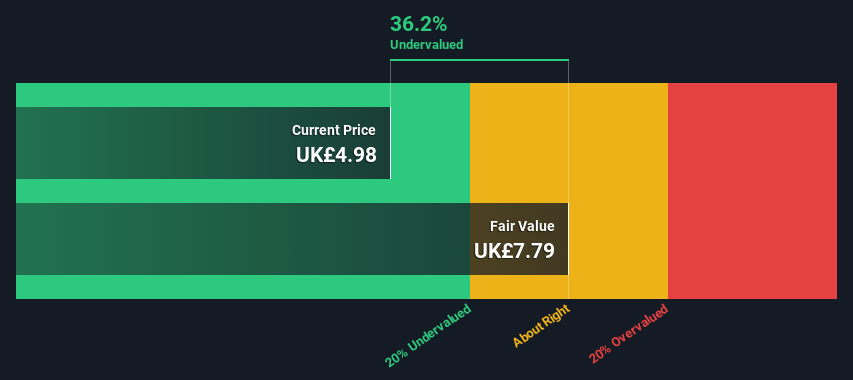
Is There An Opportunity With Babcock International Group PLC's (LON:BAB) 36% Undervaluation?


Key Insights
- The projected fair value for Babcock International Group is UK£7.79 based on 2 Stage Free Cash Flow to Equity
- Babcock International Group's UK£4.98 share price signals that it might be 36% undervalued
- Analyst price target for BAB is UK£5.36 which is 31% below our fair value estimate
How far off is Babcock International Group PLC (LON:BAB) from its intrinsic value? Using the most recent financial data, we'll take a look at whether the stock is fairly priced by taking the forecast future cash flows of the company and discounting them back to today's value. This will be done using the Discounted Cash Flow (DCF) model. Believe it or not, it's not too difficult to follow, as you'll see from our example!
Companies can be valued in a lot of ways, so we would point out that a DCF is not perfect for every situation. For those who are keen learners of equity analysis, the Simply Wall St analysis model here may be something of interest to you.
View our latest analysis for Babcock International Group
What's The Estimated Valuation?
We are going to use a two-stage DCF model, which, as the name states, takes into account two stages of growth. The first stage is generally a higher growth period which levels off heading towards the terminal value, captured in the second 'steady growth' period. To begin with, we have to get estimates of the next ten years of cash flows. Where possible we use analyst estimates, but when these aren't available we extrapolate the previous free cash flow (FCF) from the last estimate or reported value. We assume companies with shrinking free cash flow will slow their rate of shrinkage, and that companies with growing free cash flow will see their growth rate slow, over this period. We do this to reflect that growth tends to slow more in the early years than it does in later years.
A DCF is all about the idea that a dollar in the future is less valuable than a dollar today, so we need to discount the sum of these future cash flows to arrive at a present value estimate:
10-year free cash flow (FCF) forecast
| 2024 | 2025 | 2026 | 2027 | 2028 | 2029 | 2030 | 2031 | 2032 | 2033 | |
| Levered FCF (£, Millions) | UK£101.8m | UK£113.5m | UK£140.5m | UK£165.4m | UK£183.5m | UK£198.4m | UK£210.7m | UK£220.9m | UK£229.5m | UK£236.8m |
| Growth Rate Estimate Source | Analyst x7 | Analyst x7 | Analyst x7 | Analyst x4 | Est @ 10.95% | Est @ 8.16% | Est @ 6.20% | Est @ 4.83% | Est @ 3.88% | Est @ 3.20% |
| Present Value (£, Millions) Discounted @ 6.4% | UK£95.6 | UK£100 | UK£117 | UK£129 | UK£134 | UK£137 | UK£136 | UK£134 | UK£131 | UK£127 |
("Est" = FCF growth rate estimated by Simply Wall St)
Present Value of 10-year Cash Flow (PVCF) = UK£1.2b
We now need to calculate the Terminal Value, which accounts for all the future cash flows after this ten year period. For a number of reasons a very conservative growth rate is used that cannot exceed that of a country's GDP growth. In this case we have used the 5-year average of the 10-year government bond yield (1.6%) to estimate future growth. In the same way as with the 10-year 'growth' period, we discount future cash flows to today's value, using a cost of equity of 6.4%.
Terminal Value (TV)= FCF2033 × (1 + g) ÷ (r – g) = UK£237m× (1 + 1.6%) ÷ (6.4%– 1.6%) = UK£5.0b
Present Value of Terminal Value (PVTV)= TV / (1 + r)10= UK£5.0b÷ ( 1 + 6.4%)10= UK£2.7b
The total value, or equity value, is then the sum of the present value of the future cash flows, which in this case is UK£3.9b. The last step is to then divide the equity value by the number of shares outstanding. Relative to the current share price of UK£5.0, the company appears quite undervalued at a 36% discount to where the stock price trades currently. Remember though, that this is just an approximate valuation, and like any complex formula - garbage in, garbage out.
The Assumptions
Now the most important inputs to a discounted cash flow are the discount rate, and of course, the actual cash flows. If you don't agree with these result, have a go at the calculation yourself and play with the assumptions. The DCF also does not consider the possible cyclicality of an industry, or a company's future capital requirements, so it does not give a full picture of a company's potential performance. Given that we are looking at Babcock International Group as potential shareholders, the cost of equity is used as the discount rate, rather than the cost of capital (or weighted average cost of capital, WACC) which accounts for debt. In this calculation we've used 6.4%, which is based on a levered beta of 0.873. Beta is a measure of a stock's volatility, compared to the market as a whole. We get our beta from the industry average beta of globally comparable companies, with an imposed limit between 0.8 and 2.0, which is a reasonable range for a stable business.
SWOT Analysis for Babcock International Group
- Debt is well covered by earnings and cashflows.
- Earnings declined over the past year.
- Dividend is low compared to the top 25% of dividend payers in the Aerospace & Defense market.
- Annual earnings are forecast to grow faster than the British market.
- Trading below our estimate of fair value by more than 20%.
- Annual revenue is forecast to grow slower than the British market.
Moving On:
Whilst important, the DCF calculation shouldn't be the only metric you look at when researching a company. It's not possible to obtain a foolproof valuation with a DCF model. Instead the best use for a DCF model is to test certain assumptions and theories to see if they would lead to the company being undervalued or overvalued. For instance, if the terminal value growth rate is adjusted slightly, it can dramatically alter the overall result. Why is the intrinsic value higher than the current share price? For Babcock International Group, we've compiled three further items you should assess:
- Risks: Consider for instance, the ever-present spectre of investment risk. We've identified 3 warning signs with Babcock International Group , and understanding these should be part of your investment process.
- Future Earnings: How does BAB's growth rate compare to its peers and the wider market? Dig deeper into the analyst consensus number for the upcoming years by interacting with our free analyst growth expectation chart.
- Other Solid Businesses: Low debt, high returns on equity and good past performance are fundamental to a strong business. Why not explore our interactive list of stocks with solid business fundamentals to see if there are other companies you may not have considered!
PS. Simply Wall St updates its DCF calculation for every British stock every day, so if you want to find the intrinsic value of any other stock just search here.
Valuation is complex, but we're here to simplify it.
Discover if Babcock International Group might be undervalued or overvalued with our detailed analysis, featuring fair value estimates, potential risks, dividends, insider trades, and its financial condition.
Access Free AnalysisHave feedback on this article? Concerned about the content? Get in touch with us directly. Alternatively, email editorial-team (at) simplywallst.com.
This article by Simply Wall St is general in nature. We provide commentary based on historical data and analyst forecasts only using an unbiased methodology and our articles are not intended to be financial advice. It does not constitute a recommendation to buy or sell any stock, and does not take account of your objectives, or your financial situation. We aim to bring you long-term focused analysis driven by fundamental data. Note that our analysis may not factor in the latest price-sensitive company announcements or qualitative material. Simply Wall St has no position in any stocks mentioned.
About LSE:BAB
Babcock International Group
Engages in the design, development, manufacture, and integration of specialist systems for aerospace, defense, and security in the United Kingdom, rest of Europe, Africa, North America, Australasia, and internationally.
Very undervalued with solid track record.
Similar Companies
Market Insights

Community Narratives

