- United Kingdom
- /
- Aerospace & Defense
- /
- AIM:MSI
Returns At MS INTERNATIONAL (LON:MSI) Appear To Be Weighed Down

If you're looking for a multi-bagger, there's a few things to keep an eye out for. Ideally, a business will show two trends; firstly a growing return on capital employed (ROCE) and secondly, an increasing amount of capital employed. If you see this, it typically means it's a company with a great business model and plenty of profitable reinvestment opportunities. That's why when we briefly looked at MS INTERNATIONAL's (LON:MSI) ROCE trend, we were pretty happy with what we saw.
Understanding Return On Capital Employed (ROCE)
For those that aren't sure what ROCE is, it measures the amount of pre-tax profits a company can generate from the capital employed in its business. The formula for this calculation on MS INTERNATIONAL is:
Return on Capital Employed = Earnings Before Interest and Tax (EBIT) ÷ (Total Assets - Current Liabilities)
0.14 = UK£9.8m ÷ (UK£128m - UK£58m) (Based on the trailing twelve months to October 2023).
So, MS INTERNATIONAL has an ROCE of 14%. That's a relatively normal return on capital, and it's around the 12% generated by the Aerospace & Defense industry.
View our latest analysis for MS INTERNATIONAL
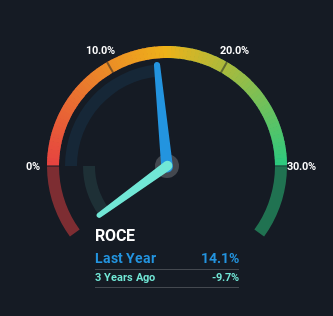
Historical performance is a great place to start when researching a stock so above you can see the gauge for MS INTERNATIONAL's ROCE against it's prior returns. If you want to delve into the historical earnings , check out these free graphs detailing revenue and cash flow performance of MS INTERNATIONAL.
What Does the ROCE Trend For MS INTERNATIONAL Tell Us?
While the returns on capital are good, they haven't moved much. The company has consistently earned 14% for the last five years, and the capital employed within the business has risen 65% in that time. 14% is a pretty standard return, and it provides some comfort knowing that MS INTERNATIONAL has consistently earned this amount. Over long periods of time, returns like these might not be too exciting, but with consistency they can pay off in terms of share price returns.
Another thing to note, MS INTERNATIONAL has a high ratio of current liabilities to total assets of 46%. This effectively means that suppliers (or short-term creditors) are funding a large portion of the business, so just be aware that this can introduce some elements of risk. While it's not necessarily a bad thing, it can be beneficial if this ratio is lower.
What We Can Learn From MS INTERNATIONAL's ROCE
To sum it up, MS INTERNATIONAL has simply been reinvesting capital steadily, at those decent rates of return. And the stock has done incredibly well with a 418% return over the last five years, so long term investors are no doubt ecstatic with that result. So while investors seem to be recognizing these promising trends, we still believe the stock deserves further research.
Like most companies, MS INTERNATIONAL does come with some risks, and we've found 1 warning sign that you should be aware of.
While MS INTERNATIONAL may not currently earn the highest returns, we've compiled a list of companies that currently earn more than 25% return on equity. Check out this free list here.
Mobile Infrastructure for Defense and Disaster
The next wave in robotics isn't humanoid. Its fully autonomous towers delivering 5G, ISR, and radar in under 30 minutes, anywhere.
Get the investor briefing before the next round of contracts
Sponsored On Behalf of CiTechNew: Manage All Your Stock Portfolios in One Place
We've created the ultimate portfolio companion for stock investors, and it's free.
• Connect an unlimited number of Portfolios and see your total in one currency
• Be alerted to new Warning Signs or Risks via email or mobile
• Track the Fair Value of your stocks
Have feedback on this article? Concerned about the content? Get in touch with us directly. Alternatively, email editorial-team (at) simplywallst.com.
This article by Simply Wall St is general in nature. We provide commentary based on historical data and analyst forecasts only using an unbiased methodology and our articles are not intended to be financial advice. It does not constitute a recommendation to buy or sell any stock, and does not take account of your objectives, or your financial situation. We aim to bring you long-term focused analysis driven by fundamental data. Note that our analysis may not factor in the latest price-sensitive company announcements or qualitative material. Simply Wall St has no position in any stocks mentioned.
About AIM:MSI
MS INTERNATIONAL
Engages in the design, manufacture, construction, and servicing various engineering products and structures in the United Kingdom, Europe, the United States of America, Asia, South America, and internationally.
Flawless balance sheet with acceptable track record.
Market Insights

Weekly Picks

THE KINGDOM OF BROWN GOODS: WHY MGPI IS BEING CRUSHED BY INVENTORY & PRIMED FOR RESURRECTION


Why Vertical Aerospace (NYSE: EVTL) is Worth Possibly Over 13x its Current Price


The Quiet Giant That Became AI’s Power Grid
Recently Updated Narratives


MINISO's fair value is projected at 26.69 with an anticipated PE ratio shift of 20x

Fiverr International will transform the freelance industry with AI-powered growth

Stride Stock: Online Education Finds Its Second Act
Popular Narratives


MicroVision will explode future revenue by 380.37% with a vision towards success


Crazy Undervalued 42 Baggers Silver Play (Active & Running Mine)


