- United Kingdom
- /
- Banks
- /
- LSE:STB
The five-year loss for Secure Trust Bank (LON:STB) shareholders likely driven by its shrinking earnings


Secure Trust Bank PLC (LON:STB) shareholders should be happy to see the share price up 16% in the last month. But if you look at the last five years the returns have not been good. After all, the share price is down 47% in that time, significantly under-performing the market.
Although the past week has been more reassuring for shareholders, they're still in the red over the last five years, so let's see if the underlying business has been responsible for the decline.
View our latest analysis for Secure Trust Bank
To quote Buffett, 'Ships will sail around the world but the Flat Earth Society will flourish. There will continue to be wide discrepancies between price and value in the marketplace...' One flawed but reasonable way to assess how sentiment around a company has changed is to compare the earnings per share (EPS) with the share price.
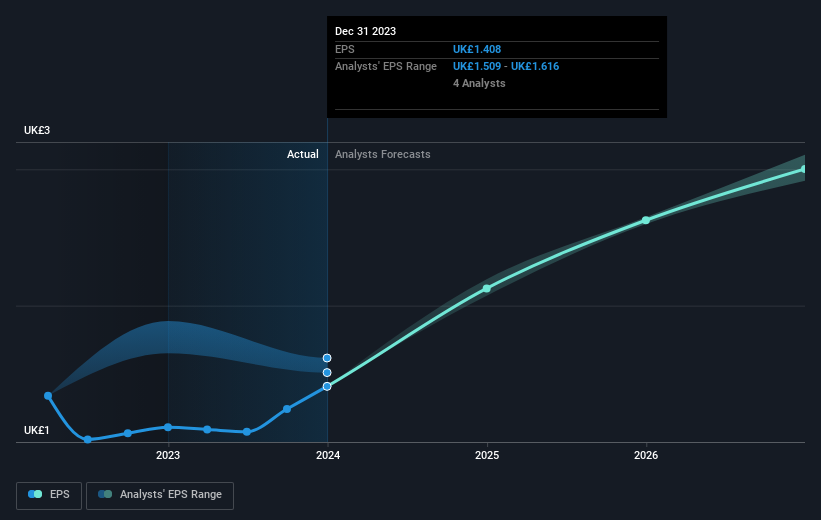
During the five years over which the share price declined, Secure Trust Bank's earnings per share (EPS) dropped by 2.0% each year. This reduction in EPS is less than the 12% annual reduction in the share price. So it seems the market was too confident about the business, in the past. The low P/E ratio of 5.83 further reflects this reticence.
The image below shows how EPS has tracked over time (if you click on the image you can see greater detail).
It's probably worth noting we've seen significant insider buying in the last quarter, which we consider a positive. On the other hand, we think the revenue and earnings trends are much more meaningful measures of the business. Before buying or selling a stock, we always recommend a close examination of historic growth trends, available here..
What About Dividends?
When looking at investment returns, it is important to consider the difference between total shareholder return (TSR) and share price return. Whereas the share price return only reflects the change in the share price, the TSR includes the value of dividends (assuming they were reinvested) and the benefit of any discounted capital raising or spin-off. It's fair to say that the TSR gives a more complete picture for stocks that pay a dividend. In the case of Secure Trust Bank, it has a TSR of -35% for the last 5 years. That exceeds its share price return that we previously mentioned. This is largely a result of its dividend payments!
A Different Perspective
It's nice to see that Secure Trust Bank shareholders have received a total shareholder return of 38% over the last year. Of course, that includes the dividend. There's no doubt those recent returns are much better than the TSR loss of 6% per year over five years. This makes us a little wary, but the business might have turned around its fortunes. It's always interesting to track share price performance over the longer term. But to understand Secure Trust Bank better, we need to consider many other factors. For instance, we've identified 1 warning sign for Secure Trust Bank that you should be aware of.
If you like to buy stocks alongside management, then you might just love this free list of companies. (Hint: most of them are flying under the radar).
Please note, the market returns quoted in this article reflect the market weighted average returns of stocks that currently trade on British exchanges.
If you're looking to trade Secure Trust Bank, open an account with the lowest-cost platform trusted by professionals, Interactive Brokers.
With clients in over 200 countries and territories, and access to 160 markets, IBKR lets you trade stocks, options, futures, forex, bonds and funds from a single integrated account.
Enjoy no hidden fees, no account minimums, and FX conversion rates as low as 0.03%, far better than what most brokers offer.
Sponsored ContentNew: Manage All Your Stock Portfolios in One Place
We've created the ultimate portfolio companion for stock investors, and it's free.
• Connect an unlimited number of Portfolios and see your total in one currency
• Be alerted to new Warning Signs or Risks via email or mobile
• Track the Fair Value of your stocks
Have feedback on this article? Concerned about the content? Get in touch with us directly. Alternatively, email editorial-team (at) simplywallst.com.
This article by Simply Wall St is general in nature. We provide commentary based on historical data and analyst forecasts only using an unbiased methodology and our articles are not intended to be financial advice. It does not constitute a recommendation to buy or sell any stock, and does not take account of your objectives, or your financial situation. We aim to bring you long-term focused analysis driven by fundamental data. Note that our analysis may not factor in the latest price-sensitive company announcements or qualitative material. Simply Wall St has no position in any stocks mentioned.
About LSE:STB
Secure Trust Bank
Provides banking and financial products and services in the United Kingdom.
Undervalued with reasonable growth potential.
Similar Companies
Market Insights

Community Narratives

