
Advertisement

OSB Group (LON:OSB) Full Year 2022 Results
Key Financial Results
- Revenue: UK£744.7m (up 18% from FY 2021).
- Net income: UK£401.0m (up 18% from FY 2021).
- Profit margin: 54% (in line with FY 2021).
- EPS: UK£0.91 (up from UK£0.76 in FY 2021).
OSB Banking Performance Indicators
- Net interest margin (NIM): 2.78% (up from 2.53% in FY 2021).
- Cost-to-income ratio: 25.0% (up from 24.0% in FY 2021).
- Non-performing loans: 2.48% (down from 2.65% in FY 2021).
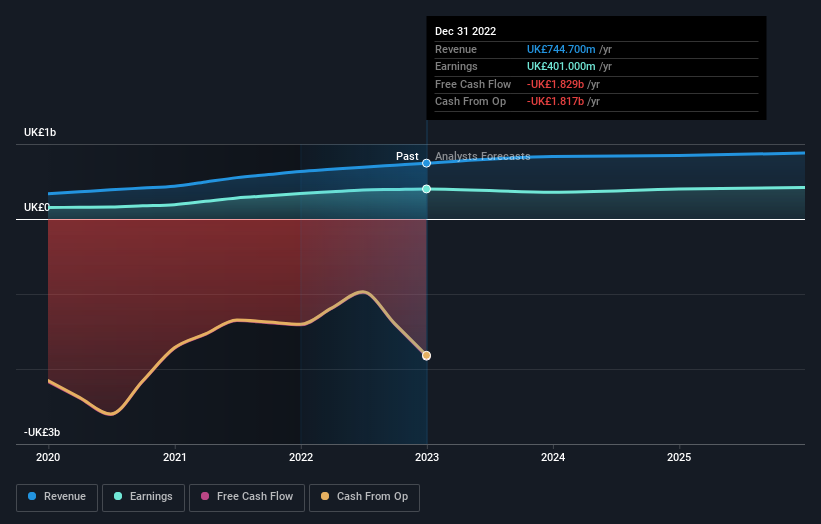
All figures shown in the chart above are for the trailing 12 month (TTM) period
OSB Group Revenues and Earnings Beat Expectations
Revenue exceeded analyst estimates by 6.5%. Earnings per share (EPS) also surpassed analyst estimates by 1.4%.
Looking ahead, revenue is forecast to grow 5.4% p.a. on average during the next 3 years, compared to a 5.5% growth forecast for the Mortgage industry in Europe.
Performance of the market in the United Kingdom.
The company's shares are down 7.4% from a week ago.
Risk Analysis
It's necessary to consider the ever-present spectre of investment risk. We've identified 2 warning signs with OSB Group (at least 1 which is concerning), and understanding these should be part of your investment process.
New: AI Stock Screener & Alerts
Our new AI Stock Screener scans the market every day to uncover opportunities.
• Dividend Powerhouses (3%+ Yield)
• Undervalued Small Caps with Insider Buying
• High growth Tech and AI Companies
Or build your own from over 50 metrics.
Have feedback on this article? Concerned about the content? Get in touch with us directly. Alternatively, email editorial-team (at) simplywallst.com.
This article by Simply Wall St is general in nature. We provide commentary based on historical data and analyst forecasts only using an unbiased methodology and our articles are not intended to be financial advice. It does not constitute a recommendation to buy or sell any stock, and does not take account of your objectives, or your financial situation. We aim to bring you long-term focused analysis driven by fundamental data. Note that our analysis may not factor in the latest price-sensitive company announcements or qualitative material. Simply Wall St has no position in any stocks mentioned.
About LSE:OSB
OSB Group
Through its subsidiaries, operates as a specialist mortgage lending company in the United Kingdom and India.
Very undervalued established dividend payer.
Similar Companies
Market Insights

Advertisement
Community Narratives

Apple: A Dying Star with an Overpriced Valuation
Fair Value US$177.34|18.9% overvalued
IN
Community Contributor
Avino a case for USD$20 per share within 5 years (assuming $3,500 gold, $100 silver and $4 copper).
Fair Value CA$26.79|87.5% undervalued
AG
Community Contributor
Riding the Defense Boom RENK Sees Revenue Climb at 15% CAGR by FY 2029
Fair Value €69.87|22.2% undervalued
CH
Community Contributor