
Advertisement
- France
- /
- Renewable Energy
- /
- ENXTPA:NEOEN
Those who invested in Neoen (EPA:NEOEN) three years ago are up 108%
By buying an index fund, investors can approximate the average market return. But if you pick the right individual stocks, you could make more than that. For example, Neoen S.A. (EPA:NEOEN) shareholders have seen the share price rise 92% over three years, well in excess of the market return (45%, not including dividends).
With that in mind, it's worth seeing if the company's underlying fundamentals have been the driver of long term performance, or if there are some discrepancies.
View our latest analysis for Neoen
While the efficient markets hypothesis continues to be taught by some, it has been proven that markets are over-reactive dynamic systems, and investors are not always rational. One imperfect but simple way to consider how the market perception of a company has shifted is to compare the change in the earnings per share (EPS) with the share price movement.
During the three years of share price growth, Neoen actually saw its earnings per share (EPS) drop 51% per year. This was, in part, due to extraordinary items impacting earning in the last twelve months.
Thus, it seems unlikely that the market is focussed on EPS growth at the moment. Given this situation, it makes sense to look at other metrics too.
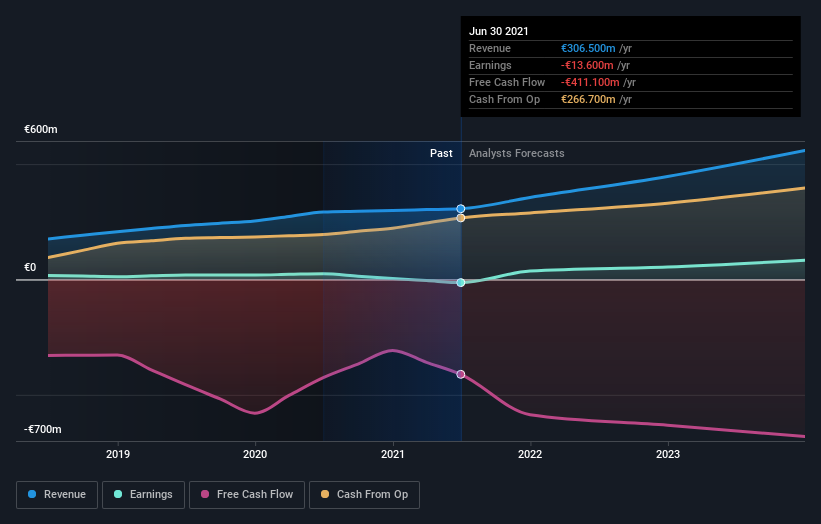
It may well be that Neoen revenue growth rate of 18% over three years has convinced shareholders to believe in a brighter future. In that case, the company may be sacrificing current earnings per share to drive growth, and maybe shareholder's faith in better days ahead will be rewarded.
The image below shows how earnings and revenue have tracked over time (if you click on the image you can see greater detail).
Neoen is well known by investors, and plenty of clever analysts have tried to predict the future profit levels. If you are thinking of buying or selling Neoen stock, you should check out this free report showing analyst consensus estimates for future profits.
What about the Total Shareholder Return (TSR)?
We'd be remiss not to mention the difference between Neoen's total shareholder return (TSR) and its share price return. The TSR is a return calculation that accounts for the value of cash dividends (assuming that any dividend received was reinvested) and the calculated value of any discounted capital raisings and spin-offs. We note that Neoen's TSR, at 108% is higher than its share price return of 92%. When you consider it hasn't been paying a dividend, this data suggests shareholders have benefitted from a spin-off, or had the opportunity to acquire attractively priced shares in a discounted capital raising.
A Different Perspective
Neoen shareholders are down 14% for the year, but the broader market is up 34%. Of course the long term matters more than the short term, and even great stocks will sometimes have a poor year. Investors are up over three years, booking 28% per year, much better than the more recent returns. Sometimes when a good quality long term winner has a weak period, it's turns out to be an opportunity, but you really need to be sure that the quality is there. I find it very interesting to look at share price over the long term as a proxy for business performance. But to truly gain insight, we need to consider other information, too. For example, we've discovered 2 warning signs for Neoen (1 is potentially serious!) that you should be aware of before investing here.
But note: Neoen may not be the best stock to buy. So take a peek at this free list of interesting companies with past earnings growth (and further growth forecast).
Please note, the market returns quoted in this article reflect the market weighted average returns of stocks that currently trade on FR exchanges.
Valuation is complex, but we're here to simplify it.
Discover if Neoen might be undervalued or overvalued with our detailed analysis, featuring fair value estimates, potential risks, dividends, insider trades, and its financial condition.
Access Free AnalysisThis article by Simply Wall St is general in nature. We provide commentary based on historical data and analyst forecasts only using an unbiased methodology and our articles are not intended to be financial advice. It does not constitute a recommendation to buy or sell any stock, and does not take account of your objectives, or your financial situation. We aim to bring you long-term focused analysis driven by fundamental data. Note that our analysis may not factor in the latest price-sensitive company announcements or qualitative material. Simply Wall St has no position in any stocks mentioned.
Have feedback on this article? Concerned about the content? Get in touch with us directly. Alternatively, email editorial-team (at) simplywallst.com.
About ENXTPA:NEOEN
Neoen
An independent renewable energy production company, engages in the development and operation of renewable energy power plants.
Reasonable growth potential low.
Similar Companies
Market Insights

Advertisement
Community Narratives
A formidable player in AI and enterprise computing.
Fair Value US$210.00|12.2% overvalued
CO
Community Contributor
IREN's Bold Moves in Sustainable Bitcoin Mining & AI Data Centers
Fair Value US$72.52|17.1% undervalued
BL
Community Contributor
Cooling the Champions: The Aussie Tech Behind F1's Victories
Fair Value AU$12.40|38.1% undervalued
TR
Community Contributor