

Some say volatility, rather than debt, is the best way to think about risk as an investor, but Warren Buffett famously said that 'Volatility is far from synonymous with risk.' When we think about how risky a company is, we always like to look at its use of debt, since debt overload can lead to ruin. Importantly, Ipsen S.A. (EPA:IPN) does carry debt. But the real question is whether this debt is making the company risky.
What Risk Does Debt Bring?
Debt is a tool to help businesses grow, but if a business is incapable of paying off its lenders, then it exists at their mercy. Ultimately, if the company can't fulfill its legal obligations to repay debt, shareholders could walk away with nothing. While that is not too common, we often do see indebted companies permanently diluting shareholders because lenders force them to raise capital at a distressed price. Having said that, the most common situation is where a company manages its debt reasonably well - and to its own advantage. When we think about a company's use of debt, we first look at cash and debt together.
Check out our latest analysis for Ipsen
What Is Ipsen's Debt?
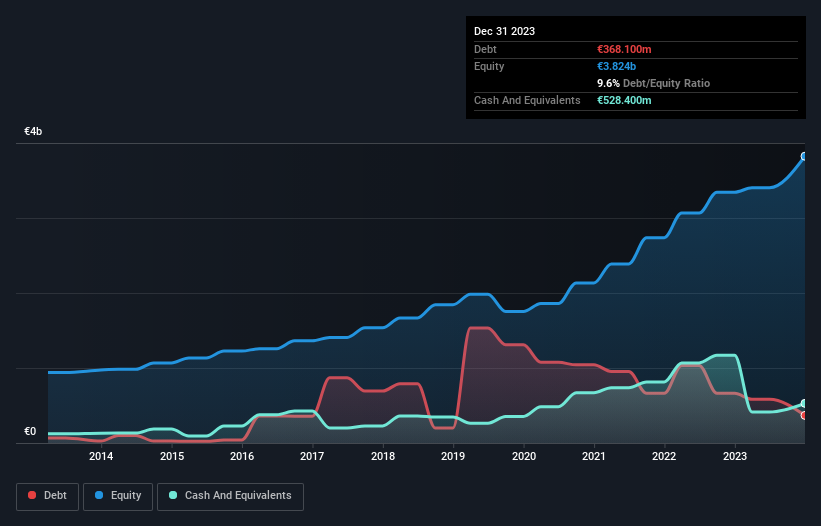
You can click the graphic below for the historical numbers, but it shows that Ipsen had €368.1m of debt in December 2023, down from €661.9m, one year before. However, it does have €528.4m in cash offsetting this, leading to net cash of €160.3m.
How Healthy Is Ipsen's Balance Sheet?
According to the last reported balance sheet, Ipsen had liabilities of €1.63b due within 12 months, and liabilities of €872.3m due beyond 12 months. Offsetting these obligations, it had cash of €528.4m as well as receivables valued at €810.8m due within 12 months. So it has liabilities totalling €1.16b more than its cash and near-term receivables, combined.
Given Ipsen has a market capitalization of €9.04b, it's hard to believe these liabilities pose much threat. Having said that, it's clear that we should continue to monitor its balance sheet, lest it change for the worse. While it does have liabilities worth noting, Ipsen also has more cash than debt, so we're pretty confident it can manage its debt safely.
On the other hand, Ipsen saw its EBIT drop by 8.8% in the last twelve months. That sort of decline, if sustained, will obviously make debt harder to handle. When analysing debt levels, the balance sheet is the obvious place to start. But it is future earnings, more than anything, that will determine Ipsen's ability to maintain a healthy balance sheet going forward. So if you're focused on the future you can check out this free report showing analyst profit forecasts.
Finally, while the tax-man may adore accounting profits, lenders only accept cold hard cash. While Ipsen has net cash on its balance sheet, it's still worth taking a look at its ability to convert earnings before interest and tax (EBIT) to free cash flow, to help us understand how quickly it is building (or eroding) that cash balance. Over the most recent three years, Ipsen recorded free cash flow worth 70% of its EBIT, which is around normal, given free cash flow excludes interest and tax. This cold hard cash means it can reduce its debt when it wants to.
Summing Up
While Ipsen does have more liabilities than liquid assets, it also has net cash of €160.3m. The cherry on top was that in converted 70% of that EBIT to free cash flow, bringing in €683m. So we are not troubled with Ipsen's debt use. Over time, share prices tend to follow earnings per share, so if you're interested in Ipsen, you may well want to click here to check an interactive graph of its earnings per share history.
If you're interested in investing in businesses that can grow profits without the burden of debt, then check out this free list of growing businesses that have net cash on the balance sheet.
New: AI Stock Screener & Alerts
Our new AI Stock Screener scans the market every day to uncover opportunities.
• Dividend Powerhouses (3%+ Yield)
• Undervalued Small Caps with Insider Buying
• High growth Tech and AI Companies
Or build your own from over 50 metrics.
Have feedback on this article? Concerned about the content? Get in touch with us directly. Alternatively, email editorial-team (at) simplywallst.com.
This article by Simply Wall St is general in nature. We provide commentary based on historical data and analyst forecasts only using an unbiased methodology and our articles are not intended to be financial advice. It does not constitute a recommendation to buy or sell any stock, and does not take account of your objectives, or your financial situation. We aim to bring you long-term focused analysis driven by fundamental data. Note that our analysis may not factor in the latest price-sensitive company announcements or qualitative material. Simply Wall St has no position in any stocks mentioned.
About ENXTPA:IPN
Flawless balance sheet and undervalued.
