
As European markets experience a positive shift with the STOXX Europe 600 Index climbing 2.10% amid easing trade tensions between the U.S. and China, investors are increasingly looking to dividend stocks as a reliable source of income in this evolving landscape. In such conditions, stocks that offer consistent dividend payouts can provide stability and enhance portfolio diversification, making them an attractive option for those seeking to capitalize on Europe's economic momentum.
Top 10 Dividend Stocks In Europe
| Name | Dividend Yield | Dividend Rating |
| Bredband2 i Skandinavien (OM:BRE2) | 4.37% | ★★★★★★ |
| Julius Bär Gruppe (SWX:BAER) | 4.50% | ★★★★★★ |
| Zurich Insurance Group (SWX:ZURN) | 4.41% | ★★★★★★ |
| Allianz (XTRA:ALV) | 4.38% | ★★★★★★ |
| ERG (BIT:ERG) | 5.97% | ★★★★★★ |
| Rubis (ENXTPA:RUI) | 6.88% | ★★★★★★ |
| S.N. Nuclearelectrica (BVB:SNN) | 8.88% | ★★★★★★ |
| HEXPOL (OM:HPOL B) | 4.73% | ★★★★★★ |
| OVB Holding (XTRA:O4B) | 4.46% | ★★★★★★ |
| Banque Cantonale Vaudoise (SWX:BCVN) | 4.51% | ★★★★★★ |
Click here to see the full list of 233 stocks from our Top European Dividend Stocks screener.
Let's uncover some gems from our specialized screener.
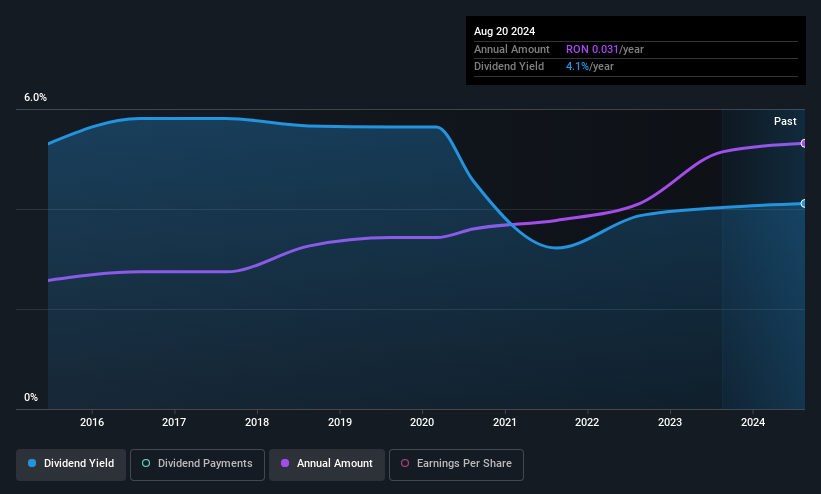
Biofarm (BVB:BIO)
Simply Wall St Dividend Rating: ★★★★★☆
Overview: Biofarm S.A. is a Romanian company that manufactures and sells medicines, with a market cap of RON701.58 million.
Operations: Biofarm S.A. generates its revenue through the manufacture and sale of medicines in Romania.
Dividend Yield: 4.4%
Biofarm S.A. offers a stable dividend yield of 4.35%, supported by a low payout ratio of 41.9% and a cash payout ratio of 48.4%, ensuring sustainability from both earnings and cash flows. While the dividend is below the top tier in Romania, it has been reliable and growing over the past decade. Recent earnings reported an increase in sales to RON 95.08 million for Q1 2025, reflecting robust financial performance that underpins its dividend strategy.
- Unlock comprehensive insights into our analysis of Biofarm stock in this dividend report.
- The valuation report we've compiled suggests that Biofarm's current price could be quite moderate.
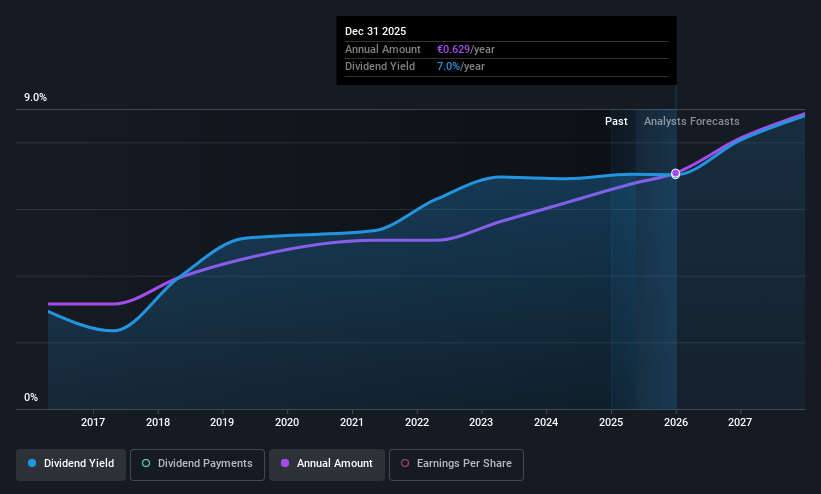
TF1 (ENXTPA:TFI)
Simply Wall St Dividend Rating: ★★★★★☆
Overview: TF1 SA operates in broadcasting, studios and entertainment, and digital sectors both in France and internationally, with a market cap of €1.87 billion.
Operations: TF1 SA generates revenue from its segments, with €2.03 billion from Media (Including Digital) and €408.40 million from Studios TF1.
Dividend Yield: 6.8%
TF1's dividend yield of 6.75% ranks in the top 25% of French dividend payers, supported by a payout ratio of 66.4% and cash payout ratio of 84.1%, indicating coverage from both earnings and cash flows. However, dividends have been volatile over the past decade, with an unstable track record despite growth in payments. Recent Q1 results show sales increased to €520.3 million, though net income declined significantly to €14.8 million year-over-year, impacting earnings reliability for future dividends.
- Get an in-depth perspective on TF1's performance by reading our dividend report here.
- In light of our recent valuation report, it seems possible that TF1 is trading behind its estimated value.
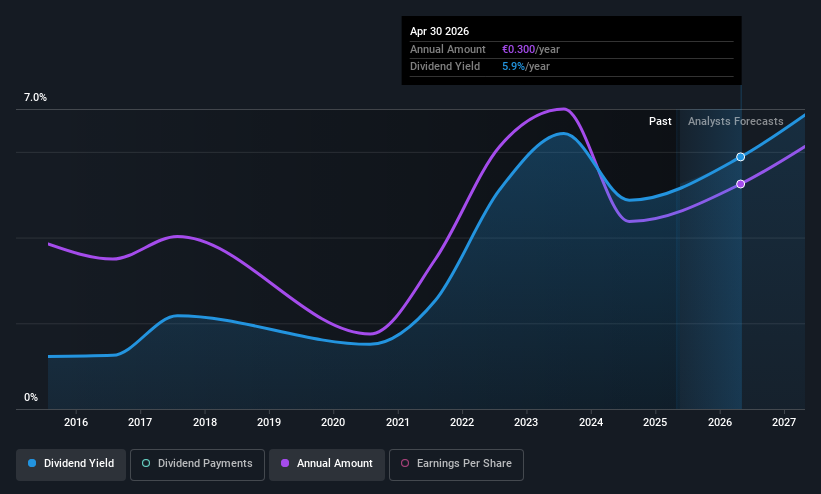
Zumtobel Group (WBAG:ZAG)
Simply Wall St Dividend Rating: ★★★★★☆
Overview: Zumtobel Group AG operates globally in the lighting industry with a market cap of €212.69 million.
Operations: Zumtobel Group AG generates its revenue from two main segments: Lighting, contributing €877.94 million, and Components, contributing €303.43 million.
Dividend Yield: 5%
Zumtobel Group's dividend yield of 5.01% places it among the top 25% of Austrian dividend payers, with a payout ratio of 65.7% and cash payout ratio of 27.4%, suggesting solid coverage from both earnings and cash flows. However, dividends have been volatile over the past decade, lacking stability despite some growth in payments. Recent Q3 results show decreased sales to €250.47 million and a net loss of €5.3 million, raising concerns about future earnings stability for dividends.
- Navigate through the intricacies of Zumtobel Group with our comprehensive dividend report here.
- According our valuation report, there's an indication that Zumtobel Group's share price might be on the cheaper side.
Taking Advantage
- Get an in-depth perspective on all 233 Top European Dividend Stocks by using our screener here.
- Have a stake in these businesses? Integrate your holdings into Simply Wall St's portfolio for notifications and detailed stock reports.
- Unlock the power of informed investing with Simply Wall St, your free guide to navigating stock markets worldwide.
Ready To Venture Into Other Investment Styles?
- Explore high-performing small cap companies that haven't yet garnered significant analyst attention.
- Fuel your portfolio with companies showing strong growth potential, backed by optimistic outlooks both from analysts and management.
- Find companies with promising cash flow potential yet trading below their fair value.
This article by Simply Wall St is general in nature. We provide commentary based on historical data and analyst forecasts only using an unbiased methodology and our articles are not intended to be financial advice. It does not constitute a recommendation to buy or sell any stock, and does not take account of your objectives, or your financial situation. We aim to bring you long-term focused analysis driven by fundamental data. Note that our analysis may not factor in the latest price-sensitive company announcements or qualitative material. Simply Wall St has no position in any stocks mentioned.
If you're looking to trade Biofarm, open an account with the lowest-cost platform trusted by professionals, Interactive Brokers.
With clients in over 200 countries and territories, and access to 160 markets, IBKR lets you trade stocks, options, futures, forex, bonds and funds from a single integrated account.
Enjoy no hidden fees, no account minimums, and FX conversion rates as low as 0.03%, far better than what most brokers offer.
Sponsored ContentValuation is complex, but we're here to simplify it.
Discover if Biofarm might be undervalued or overvalued with our detailed analysis, featuring fair value estimates, potential risks, dividends, insider trades, and its financial condition.
Access Free AnalysisHave feedback on this article? Concerned about the content? Get in touch with us directly. Alternatively, email editorial-team@simplywallst.com
About BVB:BIO
Solid track record with excellent balance sheet and pays a dividend.
Similar Companies
Market Insights

Community Narratives


