L.D.C's (EPA:LOUP) 15% CAGR outpaced the company's earnings growth over the same three-year period


By buying an index fund, you can roughly match the market return with ease. But if you choose individual stocks with prowess, you can make superior returns. For example, L.D.C. S.A. (EPA:LOUP) shareholders have seen the share price rise 43% over three years, well in excess of the market return (4.5%, not including dividends). However, more recent returns haven't been as impressive as that, with the stock returning just 18% in the last year, including dividends.
Since the stock has added €87m to its market cap in the past week alone, let's see if underlying performance has been driving long-term returns.
View our latest analysis for L.D.C
To paraphrase Benjamin Graham: Over the short term the market is a voting machine, but over the long term it's a weighing machine. One way to examine how market sentiment has changed over time is to look at the interaction between a company's share price and its earnings per share (EPS).
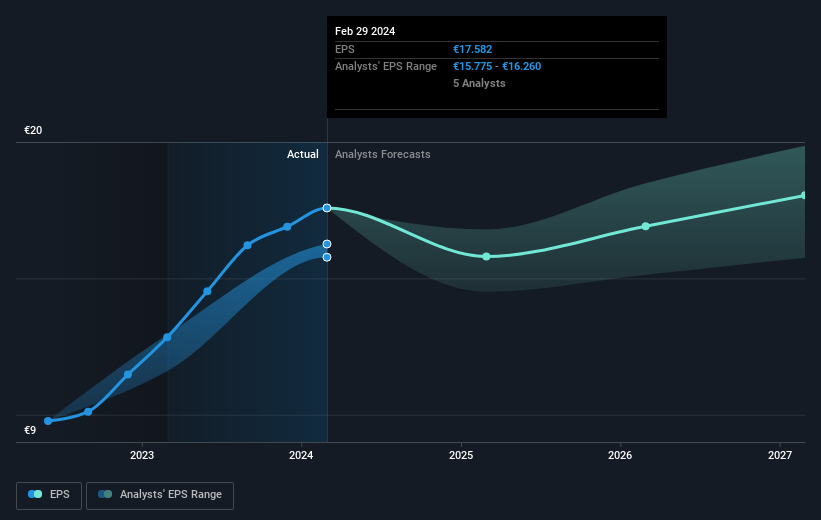
L.D.C was able to grow its EPS at 29% per year over three years, sending the share price higher. This EPS growth is higher than the 13% average annual increase in the share price. So it seems investors have become more cautious about the company, over time. We'd venture the lowish P/E ratio of 8.30 also reflects the negative sentiment around the stock.
The company's earnings per share (over time) is depicted in the image below (click to see the exact numbers).
It's probably worth noting that the CEO is paid less than the median at similar sized companies. But while CEO remuneration is always worth checking, the really important question is whether the company can grow earnings going forward. This free interactive report on L.D.C's earnings, revenue and cash flow is a great place to start, if you want to investigate the stock further.
What About Dividends?
As well as measuring the share price return, investors should also consider the total shareholder return (TSR). Whereas the share price return only reflects the change in the share price, the TSR includes the value of dividends (assuming they were reinvested) and the benefit of any discounted capital raising or spin-off. Arguably, the TSR gives a more comprehensive picture of the return generated by a stock. We note that for L.D.C the TSR over the last 3 years was 53%, which is better than the share price return mentioned above. The dividends paid by the company have thusly boosted the total shareholder return.
A Different Perspective
It's nice to see that L.D.C shareholders have received a total shareholder return of 18% over the last year. Of course, that includes the dividend. That gain is better than the annual TSR over five years, which is 7%. Therefore it seems like sentiment around the company has been positive lately. In the best case scenario, this may hint at some real business momentum, implying that now could be a great time to delve deeper. Before deciding if you like the current share price, check how L.D.C scores on these 3 valuation metrics.
If you are like me, then you will not want to miss this free list of undervalued small caps that insiders are buying.
Please note, the market returns quoted in this article reflect the market weighted average returns of stocks that currently trade on French exchanges.
New: AI Stock Screener & Alerts
Our new AI Stock Screener scans the market every day to uncover opportunities.
• Dividend Powerhouses (3%+ Yield)
• Undervalued Small Caps with Insider Buying
• High growth Tech and AI Companies
Or build your own from over 50 metrics.
Have feedback on this article? Concerned about the content? Get in touch with us directly. Alternatively, email editorial-team (at) simplywallst.com.
This article by Simply Wall St is general in nature. We provide commentary based on historical data and analyst forecasts only using an unbiased methodology and our articles are not intended to be financial advice. It does not constitute a recommendation to buy or sell any stock, and does not take account of your objectives, or your financial situation. We aim to bring you long-term focused analysis driven by fundamental data. Note that our analysis may not factor in the latest price-sensitive company announcements or qualitative material. Simply Wall St has no position in any stocks mentioned.
About ENXTPA:LOUP
L.D.C
Produces and sells poultry and processed products in France and internationally.
Very undervalued with flawless balance sheet.

