- Sweden
- /
- Trade Distributors
- /
- OM:OEM B
Discovering Europe's Hidden Stock Gems in April 2025

Reviewed by Simply Wall St

As Europe's markets navigate the turbulence of escalating global trade tensions, the pan-European STOXX Europe 600 Index recently saw a decline, reflecting broader investor apprehension. Amidst this backdrop, identifying promising small-cap stocks requires a keen eye for companies with resilient business models and growth potential that can weather economic uncertainties.
Top 10 Undiscovered Gems With Strong Fundamentals In Europe
| Name | Debt To Equity | Revenue Growth | Earnings Growth | Health Rating |
|---|---|---|---|---|
| Martifer SGPS | 123.58% | -2.38% | 5.61% | ★★★★★★ |
| Caisse Régionale de Crédit Agricole Mutuel Brie Picardie Société coopérative | 26.90% | 4.14% | 7.22% | ★★★★★★ |
| ABG Sundal Collier Holding | 8.55% | -4.14% | -12.38% | ★★★★★☆ |
| Sparta | NA | -5.54% | -15.40% | ★★★★★☆ |
| Flügger group | 20.98% | 3.24% | -29.82% | ★★★★★☆ |
| Alantra Partners | 3.79% | -3.99% | -23.83% | ★★★★★☆ |
| Infinity Capital Investments | NA | 9.92% | 22.16% | ★★★★★☆ |
| Procimmo Group | 157.49% | 0.65% | 4.94% | ★★★★☆☆ |
| Practic | NA | 13.88% | 6.89% | ★★★★☆☆ |
| MCH Group | 124.09% | 12.40% | 43.58% | ★★★★☆☆ |
Let's dive into some prime choices out of from the screener.
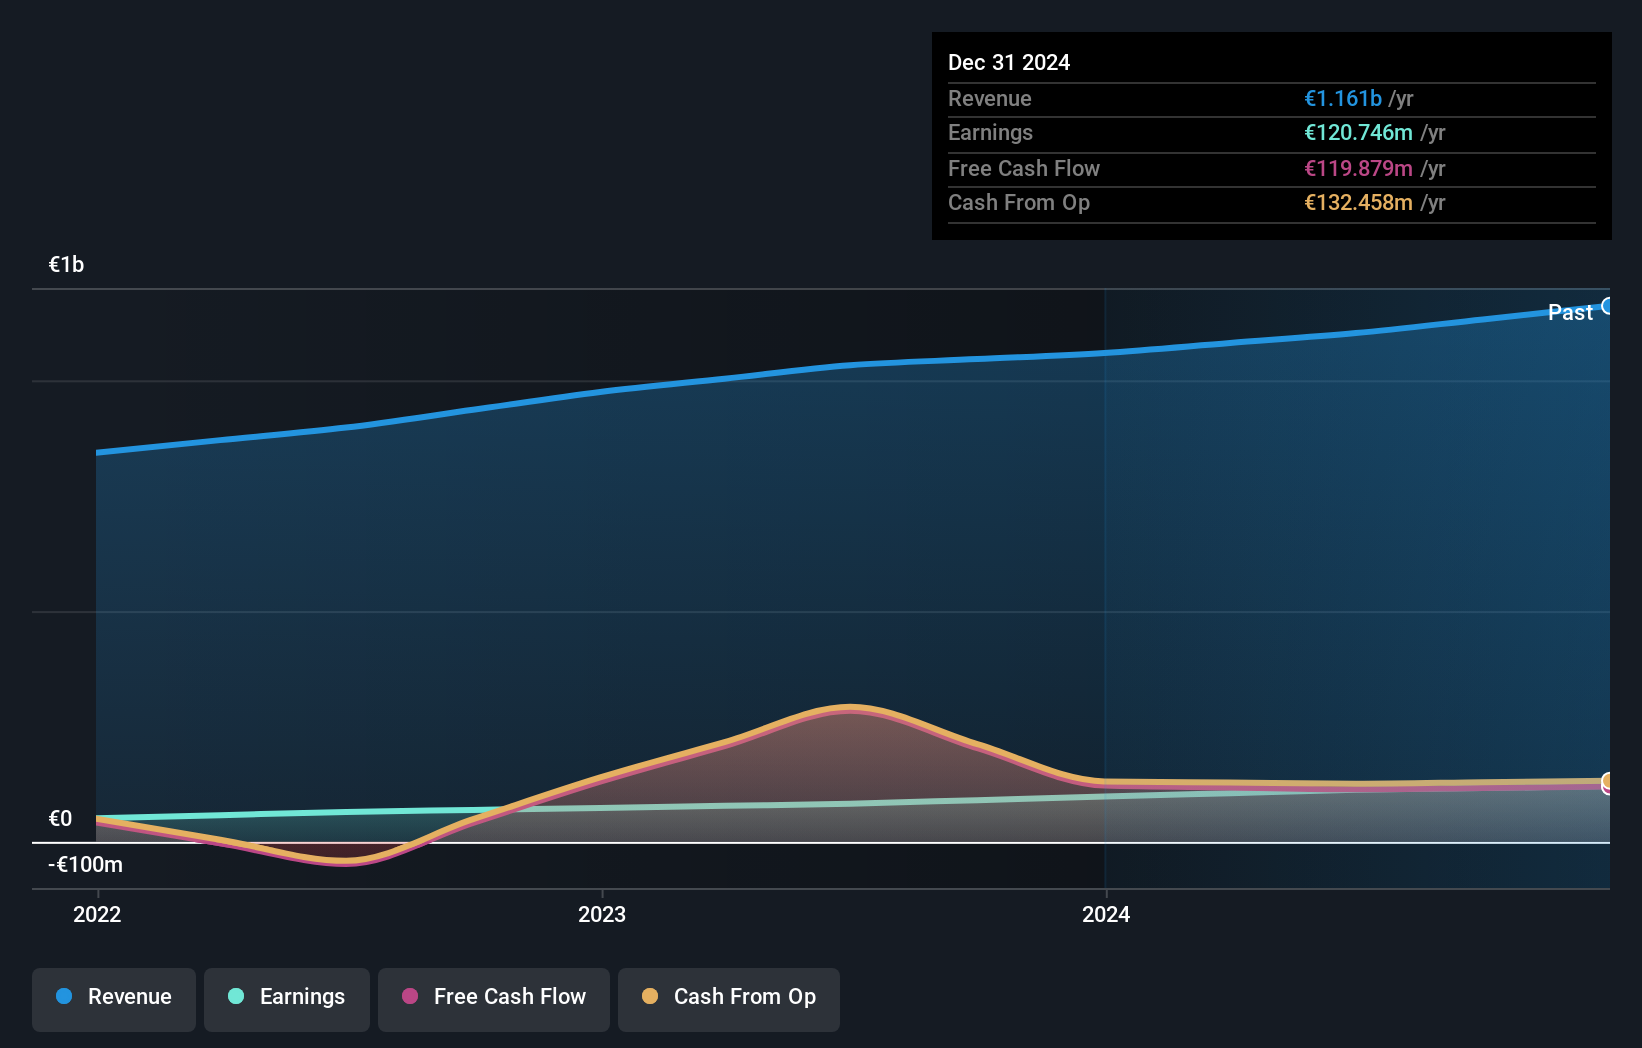
VIEL & Cie société anonyme (ENXTPA:VIL)
Simply Wall St Value Rating: ★★★★★☆
Overview: VIEL & Cie, société anonyme, is an investment company offering interdealer broking, online trading, and private banking services across multiple regions including Europe and the Asia-Pacific, with a market capitalization of approximately €847.03 million.
Operations: VIEL & Cie's revenue primarily comes from professional intermediation, generating €1.10 billion, with stock exchange online services contributing €75.40 million.
VIEL & Cie, a notable player in the financial sector, has been making strides with earnings growing by 23% over the past year, surpassing industry growth of 14%. The company is trading at a significant discount of 34.4% below its estimated fair value. Over five years, VIEL's debt to equity ratio improved from 98.3% to 62.4%, indicating stronger financial health. For the full year ending December 31, 2024, revenue reached €1.18 billion up from €1.08 billion last year and net income increased to €120.7 million from €98.1 million previously, showcasing robust performance and potential for future growth.
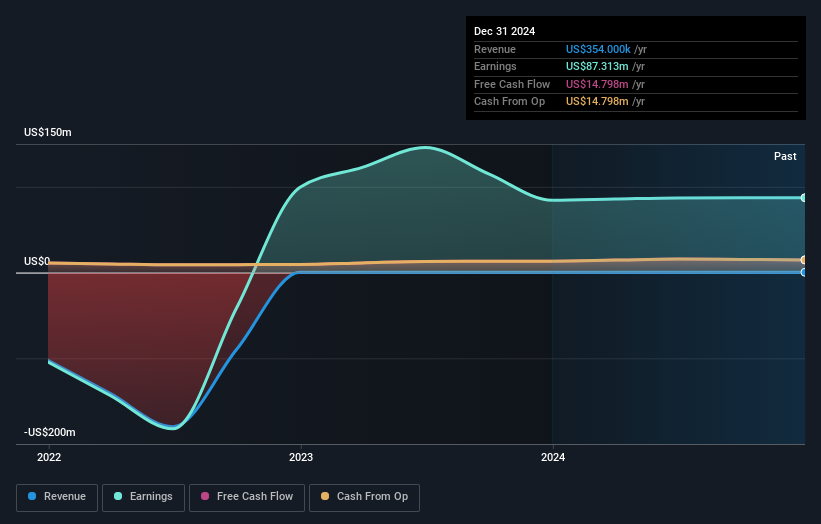
Treasure (OB:TRE)
Simply Wall St Value Rating: ★★★★★★
Overview: Treasure ASA operates by holding an 11% interest in Hyundai Glovis Co. and has a market capitalization of NOK6.12 billion.
Operations: Treasure ASA derives its revenue from an 11% stake in Hyundai Glovis Co., with reported revenue of $0.35 million. The net profit margin is a notable financial indicator for the company, reflecting its profitability relative to revenue.
Treasure, a nimble player in the market, showcases a robust financial profile with no debt over the past five years and high-quality earnings. The company's net income reached US$87.31 million last year, reflecting consistent growth of 3.5%, outpacing the logistics industry average of -4.8%. Despite generating under US$1 million in revenue, its price-to-earnings ratio stands at 6.6x, offering good value compared to Norway's broader market at 11.5x. Although recent dividends were reduced to NOK 0.70 per share, Treasure remains free cash flow positive with a levered free cash flow of US$15.30 million as of September 2024.
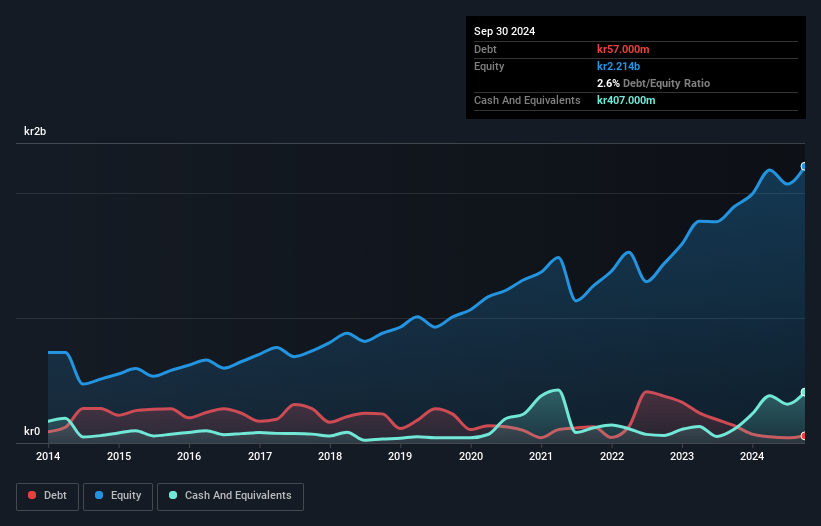
OEM International (OM:OEM B)
Simply Wall St Value Rating: ★★★★★★
Overview: OEM International AB (publ) is a technology trading company operating with subsidiaries, and it has a market capitalization of approximately SEK17.94 billion.
Operations: OEM International generates revenue through its technology trading operations, with a focus on distributing industrial components and systems. The company has demonstrated a net profit margin of 12.5%, indicating efficient cost management relative to its revenue streams.
OEM International, a noteworthy player in the trade distribution sector, has shown resilience despite recent challenges. The company boasts high-quality earnings and maintains a strong financial footing with more cash than total debt, while its interest payments are well-covered by EBIT at 77x. Over the past five years, OEM's debt-to-equity ratio improved from 10.1% to 4.1%, signaling prudent financial management. Although recent earnings growth was slightly negative at -0.2%, it fared better than the industry average of -2.1%. Recent dividend affirmations and executive changes suggest strategic positioning for future stability and potential growth within its market niche.
- Delve into the full analysis health report here for a deeper understanding of OEM International.
Understand OEM International's track record by examining our Past report.
Key Takeaways
- Dive into all 350 of the European Undiscovered Gems With Strong Fundamentals we have identified here.
- Got skin in the game with these stocks? Elevate how you manage them by using Simply Wall St's portfolio, where intuitive tools await to help optimize your investment outcomes.
- Simply Wall St is a revolutionary app designed for long-term stock investors, it's free and covers every market in the world.
Contemplating Other Strategies?
- Explore high-performing small cap companies that haven't yet garnered significant analyst attention.
- Fuel your portfolio with companies showing strong growth potential, backed by optimistic outlooks both from analysts and management.
- Find companies with promising cash flow potential yet trading below their fair value.
This article by Simply Wall St is general in nature. We provide commentary based on historical data and analyst forecasts only using an unbiased methodology and our articles are not intended to be financial advice. It does not constitute a recommendation to buy or sell any stock, and does not take account of your objectives, or your financial situation. We aim to bring you long-term focused analysis driven by fundamental data. Note that our analysis may not factor in the latest price-sensitive company announcements or qualitative material. Simply Wall St has no position in any stocks mentioned.
If you're looking to trade OEM International, open an account with the lowest-cost platform trusted by professionals, Interactive Brokers.
With clients in over 200 countries and territories, and access to 160 markets, IBKR lets you trade stocks, options, futures, forex, bonds and funds from a single integrated account.
Enjoy no hidden fees, no account minimums, and FX conversion rates as low as 0.03%, far better than what most brokers offer.
Sponsored ContentNew: AI Stock Screener & Alerts
Our new AI Stock Screener scans the market every day to uncover opportunities.
• Dividend Powerhouses (3%+ Yield)
• Undervalued Small Caps with Insider Buying
• High growth Tech and AI Companies
Or build your own from over 50 metrics.
Have feedback on this article? Concerned about the content? Get in touch with us directly. Alternatively, email editorial-team@simplywallst.com
About OM:OEM B
Flawless balance sheet with acceptable track record.
Similar Companies
Market Insights

Community Narratives

