
Key Insights
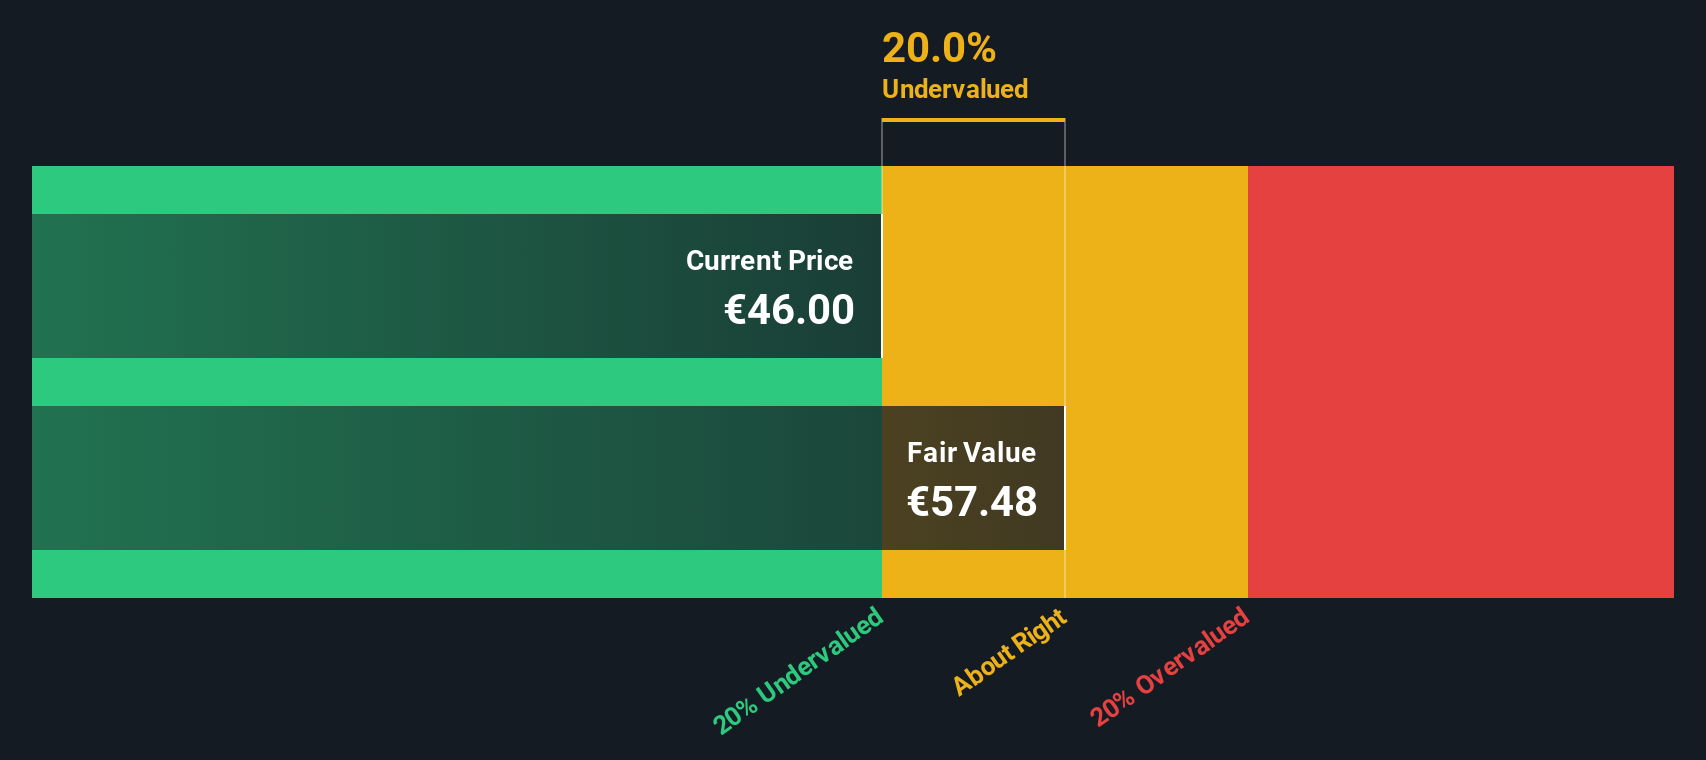
- The projected fair value for Lisi is €57.48 based on 2 Stage Free Cash Flow to Equity
- Current share price of €46.00 suggests Lisi is potentially trading close to its fair value
- Our fair value estimate is 30% higher than Lisi's analyst price target of €44.09
In this article we are going to estimate the intrinsic value of Lisi S.A. (EPA:FII) by estimating the company's future cash flows and discounting them to their present value. We will use the Discounted Cash Flow (DCF) model on this occasion. It may sound complicated, but actually it is quite simple!
Companies can be valued in a lot of ways, so we would point out that a DCF is not perfect for every situation. Anyone interested in learning a bit more about intrinsic value should have a read of the Simply Wall St analysis model.
The Method
We're using the 2-stage growth model, which simply means we take in account two stages of company's growth. In the initial period the company may have a higher growth rate and the second stage is usually assumed to have a stable growth rate. To start off with, we need to estimate the next ten years of cash flows. Where possible we use analyst estimates, but when these aren't available we extrapolate the previous free cash flow (FCF) from the last estimate or reported value. We assume companies with shrinking free cash flow will slow their rate of shrinkage, and that companies with growing free cash flow will see their growth rate slow, over this period. We do this to reflect that growth tends to slow more in the early years than it does in later years.
A DCF is all about the idea that a dollar in the future is less valuable than a dollar today, and so the sum of these future cash flows is then discounted to today's value:
10-year free cash flow (FCF) estimate
| 2026 | 2027 | 2028 | 2029 | 2030 | 2031 | 2032 | 2033 | 2034 | 2035 | |
| Levered FCF (€, Millions) | €93.0m | €115.9m | €133.0m | €147.4m | €159.5m | €169.5m | €178.0m | €185.2m | €191.5m | €197.2m |
| Growth Rate Estimate Source | Analyst x3 | Analyst x3 | Est @ 14.72% | Est @ 10.87% | Est @ 8.18% | Est @ 6.30% | Est @ 4.98% | Est @ 4.05% | Est @ 3.41% | Est @ 2.96% |
| Present Value (€, Millions) Discounted @ 7.8% | €86.2 | €99.8 | €106 | €109 | €110 | €108 | €105 | €102 | €97.5 | €93.1 |
("Est" = FCF growth rate estimated by Simply Wall St)
Present Value of 10-year Cash Flow (PVCF) = €1.0b
The second stage is also known as Terminal Value, this is the business's cash flow after the first stage. For a number of reasons a very conservative growth rate is used that cannot exceed that of a country's GDP growth. In this case we have used the 5-year average of the 10-year government bond yield (1.9%) to estimate future growth. In the same way as with the 10-year 'growth' period, we discount future cash flows to today's value, using a cost of equity of 7.8%.
Terminal Value (TV)= FCF2035 × (1 + g) ÷ (r – g) = €197m× (1 + 1.9%) ÷ (7.8%– 1.9%) = €3.4b
Present Value of Terminal Value (PVTV)= TV / (1 + r)10= €3.4b÷ ( 1 + 7.8%)10= €1.6b
The total value, or equity value, is then the sum of the present value of the future cash flows, which in this case is €2.6b. The last step is to then divide the equity value by the number of shares outstanding. Relative to the current share price of €46.0, the company appears about fair value at a 20% discount to where the stock price trades currently. The assumptions in any calculation have a big impact on the valuation, so it is better to view this as a rough estimate, not precise down to the last cent.
The Assumptions
Now the most important inputs to a discounted cash flow are the discount rate, and of course, the actual cash flows. If you don't agree with these result, have a go at the calculation yourself and play with the assumptions. The DCF also does not consider the possible cyclicality of an industry, or a company's future capital requirements, so it does not give a full picture of a company's potential performance. Given that we are looking at Lisi as potential shareholders, the cost of equity is used as the discount rate, rather than the cost of capital (or weighted average cost of capital, WACC) which accounts for debt. In this calculation we've used 7.8%, which is based on a levered beta of 1.155. Beta is a measure of a stock's volatility, compared to the market as a whole. We get our beta from the industry average beta of globally comparable companies, with an imposed limit between 0.8 and 2.0, which is a reasonable range for a stable business.
Check out our latest analysis for Lisi
SWOT Analysis for Lisi
- Debt is well covered by earnings and cashflows.
- Earnings growth over the past year underperformed the Aerospace & Defense industry.
- Dividend is low compared to the top 25% of dividend payers in the Aerospace & Defense market.
- Annual earnings are forecast to grow faster than the French market.
- Current share price is below our estimate of fair value.
- Revenue is forecast to grow slower than 20% per year.
Moving On:
Although the valuation of a company is important, it ideally won't be the sole piece of analysis you scrutinize for a company. DCF models are not the be-all and end-all of investment valuation. Preferably you'd apply different cases and assumptions and see how they would impact the company's valuation. For example, changes in the company's cost of equity or the risk free rate can significantly impact the valuation. For Lisi, there are three pertinent elements you should assess:
- Risks: As an example, we've found 2 warning signs for Lisi that you need to consider before investing here.
- Future Earnings: How does FII's growth rate compare to its peers and the wider market? Dig deeper into the analyst consensus number for the upcoming years by interacting with our free analyst growth expectation chart.
- Other High Quality Alternatives: Do you like a good all-rounder? Explore our interactive list of high quality stocks to get an idea of what else is out there you may be missing!
PS. Simply Wall St updates its DCF calculation for every French stock every day, so if you want to find the intrinsic value of any other stock just search here.
Mobile Infrastructure for Defense and Disaster
The next wave in robotics isn't humanoid. Its fully autonomous towers delivering 5G, ISR, and radar in under 30 minutes, anywhere.
Get the investor briefing before the next round of contracts
Sponsored On Behalf of CiTechNew: AI Stock Screener & Alerts
Our new AI Stock Screener scans the market every day to uncover opportunities.
• Dividend Powerhouses (3%+ Yield)
• Undervalued Small Caps with Insider Buying
• High growth Tech and AI Companies
Or build your own from over 50 metrics.
Have feedback on this article? Concerned about the content? Get in touch with us directly. Alternatively, email editorial-team (at) simplywallst.com.
This article by Simply Wall St is general in nature. We provide commentary based on historical data and analyst forecasts only using an unbiased methodology and our articles are not intended to be financial advice. It does not constitute a recommendation to buy or sell any stock, and does not take account of your objectives, or your financial situation. We aim to bring you long-term focused analysis driven by fundamental data. Note that our analysis may not factor in the latest price-sensitive company announcements or qualitative material. Simply Wall St has no position in any stocks mentioned.
About ENXTPA:FII
Lisi
Designs and produces assembly and component solutions for the aerospace, automotive, and medical sectors in France and internationally.
Reasonable growth potential with adequate balance sheet.
Market Insights

Weekly Picks

Early mover in a fast growing industry. Likely to experience share price volatility as they scale


A case for CA$31.80 (undiluted), aka 8,616% upside from CA$0.37 (an 86 bagger!).


Moderation and Stabilisation: HOLD: Fair Price based on a 4-year Cycle is $12.08
Recently Updated Narratives

Salesforce Stock: AI-Fueled Growth Is Real — But Can Margins Stay This Strong?

Shopify: The Quiet Shift From Store Builder to Commerce Operating System

UnitedHealth Stock: Why Scale, Data, and Integration Still Matter in U.S. Healthcare
Popular Narratives


MicroVision will explode future revenue by 380.37% with a vision towards success


Crazy Undervalued 42 Baggers Silver Play (Active & Running Mine)


