The five-year shareholder returns and company earnings persist lower as Renault (EPA:RNO) stock falls a further 8.0% in past week

Ideally, your overall portfolio should beat the market average. But in any portfolio, there will be mixed results between individual stocks. At this point some shareholders may be questioning their investment in Renault SA (EPA:RNO), since the last five years saw the share price fall 32%. Furthermore, it's down 24% in about a quarter. That's not much fun for holders.
Since Renault has shed €905m from its value in the past 7 days, let's see if the longer term decline has been driven by the business' economics.
See our latest analysis for Renault
While markets are a powerful pricing mechanism, share prices reflect investor sentiment, not just underlying business performance. By comparing earnings per share (EPS) and share price changes over time, we can get a feel for how investor attitudes to a company have morphed over time.
During five years of share price growth, Renault moved from a loss to profitability. Most would consider that to be a good thing, so it's counter-intuitive to see the share price declining. Other metrics might give us a better handle on how its value is changing over time.
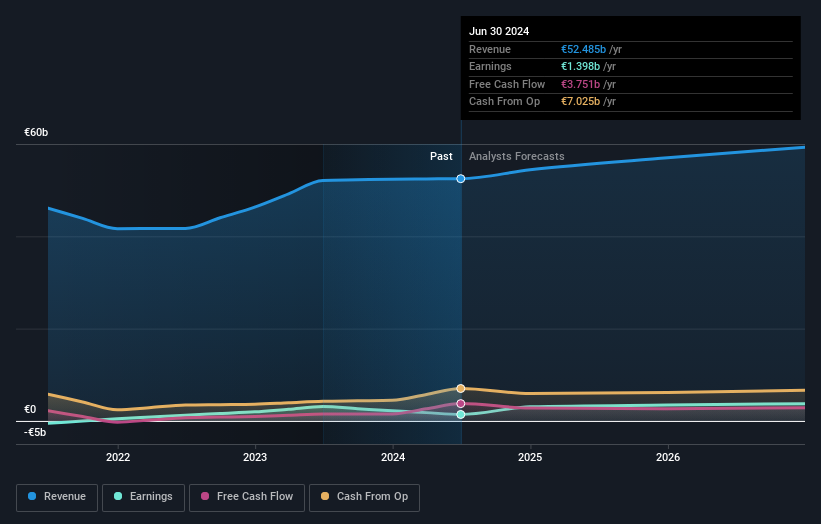
The most recent dividend was actually lower than it was in the past, so that may have sent the share price lower. The revenue decline of around 0.2% would not have helped the stock price. So the the weak dividend and revenue data could well help explain the soft share price.
You can see how earnings and revenue have changed over time in the image below (click on the chart to see the exact values).
Renault is a well known stock, with plenty of analyst coverage, suggesting some visibility into future growth. So we recommend checking out this free report showing consensus forecasts
What About Dividends?
It is important to consider the total shareholder return, as well as the share price return, for any given stock. Whereas the share price return only reflects the change in the share price, the TSR includes the value of dividends (assuming they were reinvested) and the benefit of any discounted capital raising or spin-off. Arguably, the TSR gives a more comprehensive picture of the return generated by a stock. We note that for Renault the TSR over the last 5 years was -29%, which is better than the share price return mentioned above. And there's no prize for guessing that the dividend payments largely explain the divergence!
A Different Perspective
It's good to see that Renault has rewarded shareholders with a total shareholder return of 8.9% in the last twelve months. And that does include the dividend. There's no doubt those recent returns are much better than the TSR loss of 5% per year over five years. The long term loss makes us cautious, but the short term TSR gain certainly hints at a brighter future. I find it very interesting to look at share price over the long term as a proxy for business performance. But to truly gain insight, we need to consider other information, too. Consider for instance, the ever-present spectre of investment risk. We've identified 4 warning signs with Renault (at least 1 which can't be ignored) , and understanding them should be part of your investment process.
If you are like me, then you will not want to miss this free list of undervalued small caps that insiders are buying.
Please note, the market returns quoted in this article reflect the market weighted average returns of stocks that currently trade on French exchanges.
New: AI Stock Screener & Alerts
Our new AI Stock Screener scans the market every day to uncover opportunities.
• Dividend Powerhouses (3%+ Yield)
• Undervalued Small Caps with Insider Buying
• High growth Tech and AI Companies
Or build your own from over 50 metrics.
Have feedback on this article? Concerned about the content? Get in touch with us directly. Alternatively, email editorial-team (at) simplywallst.com.
This article by Simply Wall St is general in nature. We provide commentary based on historical data and analyst forecasts only using an unbiased methodology and our articles are not intended to be financial advice. It does not constitute a recommendation to buy or sell any stock, and does not take account of your objectives, or your financial situation. We aim to bring you long-term focused analysis driven by fundamental data. Note that our analysis may not factor in the latest price-sensitive company announcements or qualitative material. Simply Wall St has no position in any stocks mentioned.
About ENXTPA:RNO
Renault
Engages in the design, manufacture, sale, repair, maintenance, and leasing of motor vehicles in Europe, Eurasia, Africa, the Middle East, the Asia Pacific, and the Americas.
Undervalued average dividend payer.

