Stock Analysis
Renault's (EPA:RNO) one-year total shareholder returns outpace the underlying earnings growth

If you want to compound wealth in the stock market, you can do so by buying an index fund. But investors can boost returns by picking market-beating companies to own shares in. For example, the Renault SA (EPA:RNO) share price is up 48% in the last 1 year, clearly besting the market return of around 2.7% (not including dividends). So that should have shareholders smiling. Also impressive, the stock is up 40% over three years, making long term shareholders happy, too.
In light of the stock dropping 3.4% in the past week, we want to investigate the longer term story, and see if fundamentals have been the driver of the company's positive one-year return.
See our latest analysis for Renault
In his essay The Superinvestors of Graham-and-Doddsville Warren Buffett described how share prices do not always rationally reflect the value of a business. One imperfect but simple way to consider how the market perception of a company has shifted is to compare the change in the earnings per share (EPS) with the share price movement.
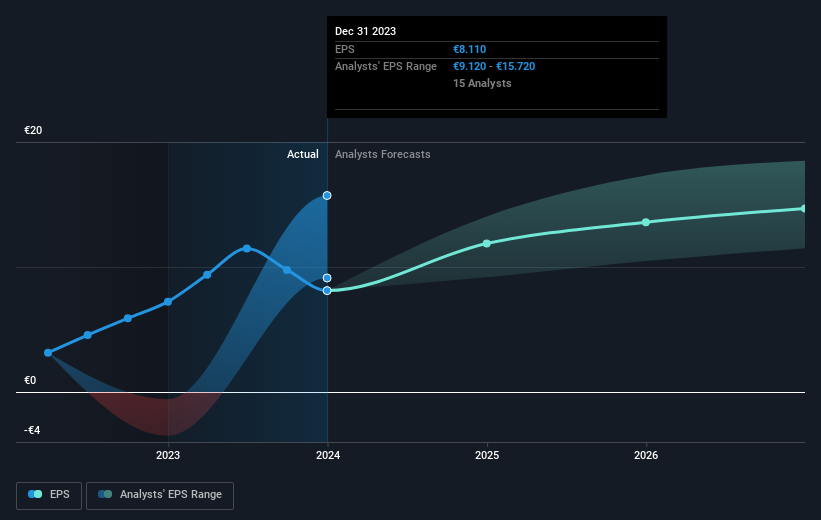
Renault was able to grow EPS by 12% in the last twelve months. The share price gain of 48% certainly outpaced the EPS growth. This indicates that the market is now more optimistic about the stock.
You can see below how EPS has changed over time (discover the exact values by clicking on the image).
It is of course excellent to see how Renault has grown profits over the years, but the future is more important for shareholders. This free interactive report on Renault's balance sheet strength is a great place to start, if you want to investigate the stock further.
What About Dividends?
As well as measuring the share price return, investors should also consider the total shareholder return (TSR). The TSR is a return calculation that accounts for the value of cash dividends (assuming that any dividend received was reinvested) and the calculated value of any discounted capital raisings and spin-offs. It's fair to say that the TSR gives a more complete picture for stocks that pay a dividend. In the case of Renault, it has a TSR of 54% for the last 1 year. That exceeds its share price return that we previously mentioned. The dividends paid by the company have thusly boosted the total shareholder return.
A Different Perspective
We're pleased to report that Renault shareholders have received a total shareholder return of 54% over one year. That's including the dividend. There's no doubt those recent returns are much better than the TSR loss of 0.6% per year over five years. The long term loss makes us cautious, but the short term TSR gain certainly hints at a brighter future. It's always interesting to track share price performance over the longer term. But to understand Renault better, we need to consider many other factors. Consider for instance, the ever-present spectre of investment risk. We've identified 3 warning signs with Renault (at least 1 which is a bit unpleasant) , and understanding them should be part of your investment process.
If you are like me, then you will not want to miss this free list of undervalued small caps that insiders are buying.
Please note, the market returns quoted in this article reflect the market weighted average returns of stocks that currently trade on French exchanges.
Valuation is complex, but we're helping make it simple.
Find out whether Renault is potentially over or undervalued by checking out our comprehensive analysis, which includes fair value estimates, risks and warnings, dividends, insider transactions and financial health.
View the Free AnalysisHave feedback on this article? Concerned about the content? Get in touch with us directly. Alternatively, email editorial-team (at) simplywallst.com.
This article by Simply Wall St is general in nature. We provide commentary based on historical data and analyst forecasts only using an unbiased methodology and our articles are not intended to be financial advice. It does not constitute a recommendation to buy or sell any stock, and does not take account of your objectives, or your financial situation. We aim to bring you long-term focused analysis driven by fundamental data. Note that our analysis may not factor in the latest price-sensitive company announcements or qualitative material. Simply Wall St has no position in any stocks mentioned.
About ENXTPA:RNO
Renault
Engages in the design, manufacture, sale, repair, maintenance, and leasing of motor vehicles in Europe, Eurasia, Africa, the Middle East, the Asia Pacific, and the Americas.
Very undervalued average dividend payer.
