- Finland
- /
- Telecom Services and Carriers
- /
- HLSE:ELISA
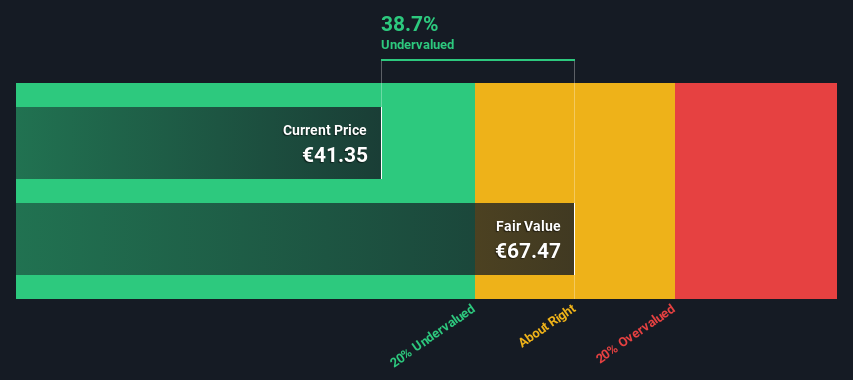
An Intrinsic Calculation For Elisa Oyj (HEL:ELISA) Suggests It's 39% Undervalued


Key Insights
- The projected fair value for Elisa Oyj is €67.47 based on 2 Stage Free Cash Flow to Equity
- Elisa Oyj's €41.35 share price signals that it might be 39% undervalued
- Our fair value estimate is 40% higher than Elisa Oyj's analyst price target of €48.36
How far off is Elisa Oyj (HEL:ELISA) from its intrinsic value? Using the most recent financial data, we'll take a look at whether the stock is fairly priced by taking the forecast future cash flows of the company and discounting them back to today's value. This will be done using the Discounted Cash Flow (DCF) model. Models like these may appear beyond the comprehension of a lay person, but they're fairly easy to follow.
Remember though, that there are many ways to estimate a company's value, and a DCF is just one method. Anyone interested in learning a bit more about intrinsic value should have a read of the Simply Wall St analysis model.
Check out our latest analysis for Elisa Oyj
Step By Step Through The Calculation
We use what is known as a 2-stage model, which simply means we have two different periods of growth rates for the company's cash flows. Generally the first stage is higher growth, and the second stage is a lower growth phase. In the first stage we need to estimate the cash flows to the business over the next ten years. Where possible we use analyst estimates, but when these aren't available we extrapolate the previous free cash flow (FCF) from the last estimate or reported value. We assume companies with shrinking free cash flow will slow their rate of shrinkage, and that companies with growing free cash flow will see their growth rate slow, over this period. We do this to reflect that growth tends to slow more in the early years than it does in later years.
A DCF is all about the idea that a dollar in the future is less valuable than a dollar today, so we need to discount the sum of these future cash flows to arrive at a present value estimate:
10-year free cash flow (FCF) forecast
| 2024 | 2025 | 2026 | 2027 | 2028 | 2029 | 2030 | 2031 | 2032 | 2033 | |
| Levered FCF (€, Millions) | €361.8m | €373.2m | €385.8m | €444.5m | €459.5m | €470.6m | €479.8m | €487.6m | €494.6m | €500.9m |
| Growth Rate Estimate Source | Analyst x7 | Analyst x7 | Analyst x7 | Analyst x2 | Analyst x2 | Est @ 2.41% | Est @ 1.96% | Est @ 1.64% | Est @ 1.42% | Est @ 1.27% |
| Present Value (€, Millions) Discounted @ 5.1% | €344 | €338 | €333 | €365 | €359 | €350 | €340 | €329 | €317 | €306 |
("Est" = FCF growth rate estimated by Simply Wall St)
Present Value of 10-year Cash Flow (PVCF) = €3.4b
After calculating the present value of future cash flows in the initial 10-year period, we need to calculate the Terminal Value, which accounts for all future cash flows beyond the first stage. The Gordon Growth formula is used to calculate Terminal Value at a future annual growth rate equal to the 5-year average of the 10-year government bond yield of 0.9%. We discount the terminal cash flows to today's value at a cost of equity of 5.1%.
Terminal Value (TV)= FCF2033 × (1 + g) ÷ (r – g) = €501m× (1 + 0.9%) ÷ (5.1%– 0.9%) = €12b
Present Value of Terminal Value (PVTV)= TV / (1 + r)10= €12b÷ ( 1 + 5.1%)10= €7.4b
The total value, or equity value, is then the sum of the present value of the future cash flows, which in this case is €11b. The last step is to then divide the equity value by the number of shares outstanding. Relative to the current share price of €41.4, the company appears quite good value at a 39% discount to where the stock price trades currently. The assumptions in any calculation have a big impact on the valuation, so it is better to view this as a rough estimate, not precise down to the last cent.
The Assumptions
The calculation above is very dependent on two assumptions. The first is the discount rate and the other is the cash flows. If you don't agree with these result, have a go at the calculation yourself and play with the assumptions. The DCF also does not consider the possible cyclicality of an industry, or a company's future capital requirements, so it does not give a full picture of a company's potential performance. Given that we are looking at Elisa Oyj as potential shareholders, the cost of equity is used as the discount rate, rather than the cost of capital (or weighted average cost of capital, WACC) which accounts for debt. In this calculation we've used 5.1%, which is based on a levered beta of 0.800. Beta is a measure of a stock's volatility, compared to the market as a whole. We get our beta from the industry average beta of globally comparable companies, with an imposed limit between 0.8 and 2.0, which is a reasonable range for a stable business.
SWOT Analysis for Elisa Oyj
- Debt is well covered by earnings and cashflows.
- Earnings growth over the past year underperformed the Telecom industry.
- Dividend is low compared to the top 25% of dividend payers in the Telecom market.
- Annual revenue is forecast to grow faster than the Finnish market.
- Trading below our estimate of fair value by more than 20%.
- Dividends are not covered by earnings and cashflows.
- Annual earnings are forecast to grow slower than the Finnish market.
Next Steps:
Although the valuation of a company is important, it is only one of many factors that you need to assess for a company. The DCF model is not a perfect stock valuation tool. Instead the best use for a DCF model is to test certain assumptions and theories to see if they would lead to the company being undervalued or overvalued. If a company grows at a different rate, or if its cost of equity or risk free rate changes sharply, the output can look very different. Why is the intrinsic value higher than the current share price? For Elisa Oyj, we've put together three further aspects you should look at:
- Risks: For example, we've discovered 2 warning signs for Elisa Oyj (1 is a bit concerning!) that you should be aware of before investing here.
- Future Earnings: How does ELISA's growth rate compare to its peers and the wider market? Dig deeper into the analyst consensus number for the upcoming years by interacting with our free analyst growth expectation chart.
- Other Solid Businesses: Low debt, high returns on equity and good past performance are fundamental to a strong business. Why not explore our interactive list of stocks with solid business fundamentals to see if there are other companies you may not have considered!
PS. Simply Wall St updates its DCF calculation for every Finnish stock every day, so if you want to find the intrinsic value of any other stock just search here.
Valuation is complex, but we're here to simplify it.
Discover if Elisa Oyj might be undervalued or overvalued with our detailed analysis, featuring fair value estimates, potential risks, dividends, insider trades, and its financial condition.
Access Free AnalysisHave feedback on this article? Concerned about the content? Get in touch with us directly. Alternatively, email editorial-team (at) simplywallst.com.
This article by Simply Wall St is general in nature. We provide commentary based on historical data and analyst forecasts only using an unbiased methodology and our articles are not intended to be financial advice. It does not constitute a recommendation to buy or sell any stock, and does not take account of your objectives, or your financial situation. We aim to bring you long-term focused analysis driven by fundamental data. Note that our analysis may not factor in the latest price-sensitive company announcements or qualitative material. Simply Wall St has no position in any stocks mentioned.
About HLSE:ELISA
Elisa Oyj
Engages in the provision of telecommunications services in Finland, rest of Europe, and internationally.
Mediocre balance sheet second-rate dividend payer.
