
Advertisement
Key Insights
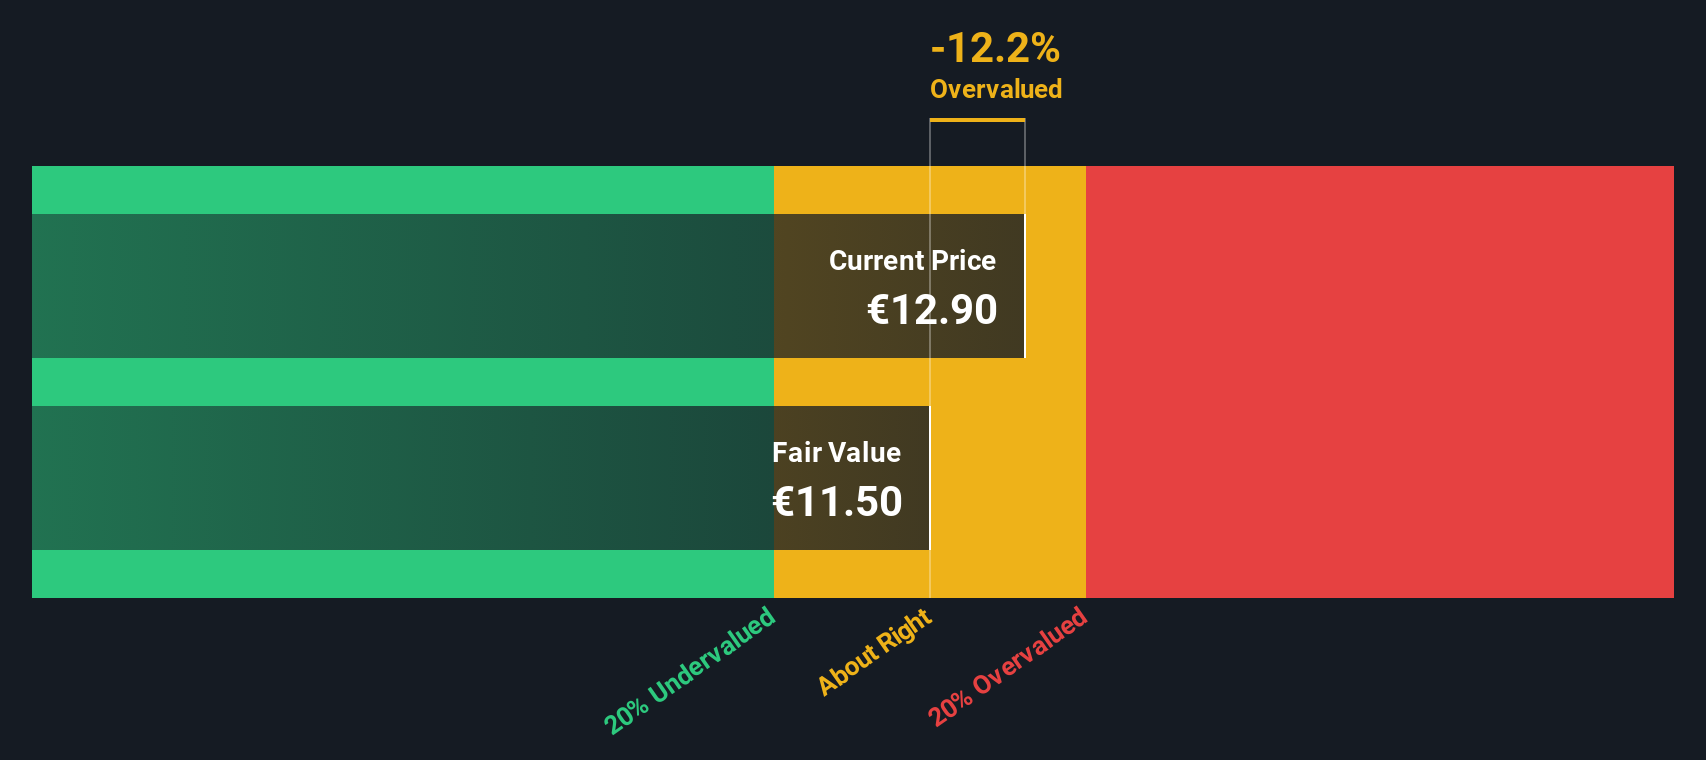
- The projected fair value for Bittium Oyj is €11.50 based on 2 Stage Free Cash Flow to Equity
- Bittium Oyj's €12.90 share price indicates it is trading at similar levels as its fair value estimate
- Bittium Oyj's peers are currently trading at a discount of 23% on average
How far off is Bittium Oyj (HEL:BITTI) from its intrinsic value? Using the most recent financial data, we'll take a look at whether the stock is fairly priced by taking the forecast future cash flows of the company and discounting them back to today's value. Our analysis will employ the Discounted Cash Flow (DCF) model. It may sound complicated, but actually it is quite simple!
Companies can be valued in a lot of ways, so we would point out that a DCF is not perfect for every situation. If you still have some burning questions about this type of valuation, take a look at the Simply Wall St analysis model.
Step By Step Through The Calculation
We use what is known as a 2-stage model, which simply means we have two different periods of growth rates for the company's cash flows. Generally the first stage is higher growth, and the second stage is a lower growth phase. In the first stage we need to estimate the cash flows to the business over the next ten years. Where possible we use analyst estimates, but when these aren't available we extrapolate the previous free cash flow (FCF) from the last estimate or reported value. We assume companies with shrinking free cash flow will slow their rate of shrinkage, and that companies with growing free cash flow will see their growth rate slow, over this period. We do this to reflect that growth tends to slow more in the early years than it does in later years.
Generally we assume that a dollar today is more valuable than a dollar in the future, and so the sum of these future cash flows is then discounted to today's value:
10-year free cash flow (FCF) forecast
| 2026 | 2027 | 2028 | 2029 | 2030 | 2031 | 2032 | 2033 | 2034 | 2035 | |
| Levered FCF (€, Millions) | €18.6m | €28.1m | €31.0m | €28.1m | €26.5m | €25.5m | €25.1m | €24.8m | €24.8m | €25.0m |
| Growth Rate Estimate Source | Analyst x1 | Analyst x1 | Analyst x1 | Analyst x1 | Est @ -5.79% | Est @ -3.51% | Est @ -1.92% | Est @ -0.81% | Est @ -0.03% | Est @ 0.52% |
| Present Value (€, Millions) Discounted @ 7.3% | €17.3 | €24.4 | €25.1 | €21.2 | €18.6 | €16.8 | €15.3 | €14.2 | €13.2 | €12.4 |
("Est" = FCF growth rate estimated by Simply Wall St)
Present Value of 10-year Cash Flow (PVCF) = €179m
We now need to calculate the Terminal Value, which accounts for all the future cash flows after this ten year period. The Gordon Growth formula is used to calculate Terminal Value at a future annual growth rate equal to the 5-year average of the 10-year government bond yield of 1.8%. We discount the terminal cash flows to today's value at a cost of equity of 7.3%.
Terminal Value (TV)= FCF2035 × (1 + g) ÷ (r – g) = €25m× (1 + 1.8%) ÷ (7.3%– 1.8%) = €464m
Present Value of Terminal Value (PVTV)= TV / (1 + r)10= €464m÷ ( 1 + 7.3%)10= €230m
The total value is the sum of cash flows for the next ten years plus the discounted terminal value, which results in the Total Equity Value, which in this case is €408m. The last step is to then divide the equity value by the number of shares outstanding. Relative to the current share price of €12.9, the company appears around fair value at the time of writing. Valuations are imprecise instruments though, rather like a telescope - move a few degrees and end up in a different galaxy. Do keep this in mind.
Important Assumptions
We would point out that the most important inputs to a discounted cash flow are the discount rate and of course the actual cash flows. If you don't agree with these result, have a go at the calculation yourself and play with the assumptions. The DCF also does not consider the possible cyclicality of an industry, or a company's future capital requirements, so it does not give a full picture of a company's potential performance. Given that we are looking at Bittium Oyj as potential shareholders, the cost of equity is used as the discount rate, rather than the cost of capital (or weighted average cost of capital, WACC) which accounts for debt. In this calculation we've used 7.3%, which is based on a levered beta of 1.187. Beta is a measure of a stock's volatility, compared to the market as a whole. We get our beta from the industry average beta of globally comparable companies, with an imposed limit between 0.8 and 2.0, which is a reasonable range for a stable business.
View our latest analysis for Bittium Oyj
SWOT Analysis for Bittium Oyj
Strength
- Earnings growth over the past year exceeded the industry.
- Debt is not viewed as a risk.
Weakness
- Dividend is low compared to the top 25% of dividend payers in the Software market.
- Current share price is above our estimate of fair value.
Opportunity
- Annual revenue is forecast to grow faster than the Finnish market.
Threat
- No apparent threats visible for BITTI.
Next Steps:
Although the valuation of a company is important, it ideally won't be the sole piece of analysis you scrutinize for a company. DCF models are not the be-all and end-all of investment valuation. Preferably you'd apply different cases and assumptions and see how they would impact the company's valuation. For example, changes in the company's cost of equity or the risk free rate can significantly impact the valuation. For Bittium Oyj, we've compiled three essential aspects you should consider:
- Risks: For instance, we've identified 2 warning signs for Bittium Oyj that you should be aware of.
- Future Earnings: How does BITTI's growth rate compare to its peers and the wider market? Dig deeper into the analyst consensus number for the upcoming years by interacting with our free analyst growth expectation chart.
- Other High Quality Alternatives: Do you like a good all-rounder? Explore our interactive list of high quality stocks to get an idea of what else is out there you may be missing!
PS. The Simply Wall St app conducts a discounted cash flow valuation for every stock on the HLSE every day. If you want to find the calculation for other stocks just search here.
Valuation is complex, but we're here to simplify it.
Discover if Bittium Oyj might be undervalued or overvalued with our detailed analysis, featuring fair value estimates, potential risks, dividends, insider trades, and its financial condition.
Access Free AnalysisHave feedback on this article? Concerned about the content? Get in touch with us directly. Alternatively, email editorial-team (at) simplywallst.com.
This article by Simply Wall St is general in nature. We provide commentary based on historical data and analyst forecasts only using an unbiased methodology and our articles are not intended to be financial advice. It does not constitute a recommendation to buy or sell any stock, and does not take account of your objectives, or your financial situation. We aim to bring you long-term focused analysis driven by fundamental data. Note that our analysis may not factor in the latest price-sensitive company announcements or qualitative material. Simply Wall St has no position in any stocks mentioned.
About HLSE:BITTI
Bittium Oyj
Provides solutions for communications and connectivity, healthcare technology products and services, and biosignal measuring and monitoring in Finland, Germany, and the United States.
High growth potential with excellent balance sheet.
Similar Companies
Market Insights

Advertisement
Weekly Picks
FA

FAI on Arabian Internet and Communication Services ·
Solutions by stc: 34% Upside in Saudi's Digital Transformation Leader
Fair Value:ر.س342.2335.3% undervalued
9 followersusers have followed this narrative
1 commentusers have commented on this narrative
3 likesusers have liked this narrative
RO


RobertoAllende on NVIDIA ·
The AI Infrastructure Giant Grows Into Its Valuation
Fair Value:US$345.0747.9% undervalued
27 followersusers have followed this narrative
28 commentsusers have commented on this narrative
21 likesusers have liked this narrative
Recently Updated Narratives
AB
Abc on Global X Etfs Icav - Global X Silver Miners Ucits ETF ·
Many trends acting at the same time
Fair Value:€10068.5% undervalued
1 followerusers have followed this narrative
0 commentsusers have commented on this narrative
0 likesusers have liked this narrative
NI


niteco on Texas Instruments ·
Engineered for Stability. Positioned for Growth.
Fair Value:US$314.4446.5% undervalued
2 followersusers have followed this narrative
0 commentsusers have commented on this narrative
0 likesusers have liked this narrative
MA


MarkoVT on Applied Digital ·
Staggered by dilution; positions for growth
Fair Value:US$35.4520.4% undervalued
2 followersusers have followed this narrative
0 commentsusers have commented on this narrative
0 likesusers have liked this narrative
Popular Narratives
TH

TheWallstreetKing on MicroVision ·
MicroVision will explode future revenue by 380.37% with a vision towards success
Fair Value:US$6098.4% undervalued
109 followersusers have followed this narrative
11 commentsusers have commented on this narrative
22 likesusers have liked this narrative
AN

AnalystConsensusTarget on NVIDIA ·
NVDA: Expanding AI Demand Will Drive Major Data Center Investments Through 2026
Fair Value:US$250.3928.1% undervalued
939 followersusers have followed this narrative
6 commentsusers have commented on this narrative
24 likesusers have liked this narrative
OS


oscargarcia on Alphabet ·
The company that turned a verb into a global necessity and basically runs the modern internet, digital ads, smartphones, maps, and AI.
Fair Value:US$3407.4% undervalued
145 followersusers have followed this narrative
6 commentsusers have commented on this narrative
18 likesusers have liked this narrative