- Spain
- /
- Gas Utilities
- /
- BME:NTGY
Shareholders in Naturgy Energy Group (BME:NTGY) are in the red if they invested a year ago


It's easy to match the overall market return by buying an index fund. While individual stocks can be big winners, plenty more fail to generate satisfactory returns. Investors in Naturgy Energy Group, S.A. (BME:NTGY) have tasted that bitter downside in the last year, as the share price dropped 13%. That's well below the market return of 23%. On the bright side, the stock is actually up 6.3% in the last three years.
So let's have a look and see if the longer term performance of the company has been in line with the underlying business' progress.
View our latest analysis for Naturgy Energy Group
While markets are a powerful pricing mechanism, share prices reflect investor sentiment, not just underlying business performance. One imperfect but simple way to consider how the market perception of a company has shifted is to compare the change in the earnings per share (EPS) with the share price movement.
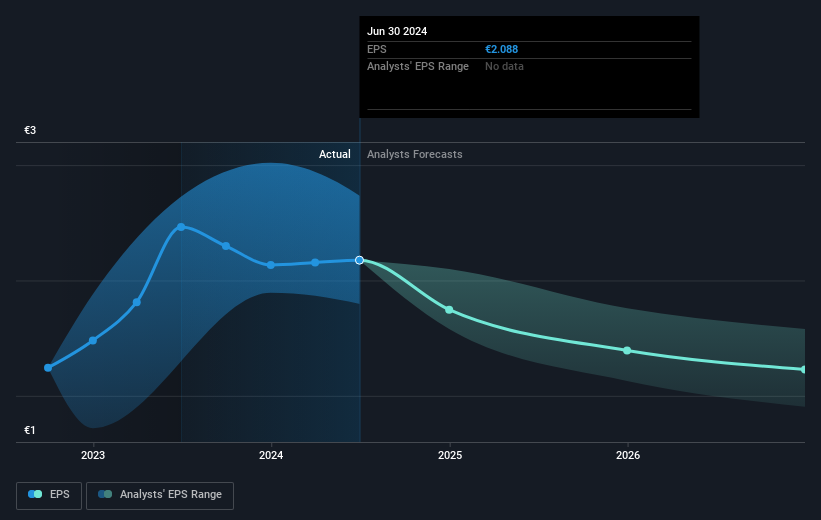
Unfortunately Naturgy Energy Group reported an EPS drop of 6.4% for the last year. The share price decline of 13% is actually more than the EPS drop. This suggests the EPS fall has made some shareholders more nervous about the business. The less favorable sentiment is reflected in its current P/E ratio of 11.10.
The graphic below depicts how EPS has changed over time (unveil the exact values by clicking on the image).
We're pleased to report that the CEO is remunerated more modestly than most CEOs at similarly capitalized companies. But while CEO remuneration is always worth checking, the really important question is whether the company can grow earnings going forward. Before buying or selling a stock, we always recommend a close examination of historic growth trends, available here..
What About Dividends?
It is important to consider the total shareholder return, as well as the share price return, for any given stock. Whereas the share price return only reflects the change in the share price, the TSR includes the value of dividends (assuming they were reinvested) and the benefit of any discounted capital raising or spin-off. So for companies that pay a generous dividend, the TSR is often a lot higher than the share price return. We note that for Naturgy Energy Group the TSR over the last 1 year was -8.1%, which is better than the share price return mentioned above. The dividends paid by the company have thusly boosted the total shareholder return.
A Different Perspective
Investors in Naturgy Energy Group had a tough year, with a total loss of 8.1% (including dividends), against a market gain of about 23%. However, keep in mind that even the best stocks will sometimes underperform the market over a twelve month period. Longer term investors wouldn't be so upset, since they would have made 4%, each year, over five years. If the fundamental data continues to indicate long term sustainable growth, the current sell-off could be an opportunity worth considering. It's always interesting to track share price performance over the longer term. But to understand Naturgy Energy Group better, we need to consider many other factors. Even so, be aware that Naturgy Energy Group is showing 4 warning signs in our investment analysis , and 1 of those doesn't sit too well with us...
Of course, you might find a fantastic investment by looking elsewhere. So take a peek at this free list of companies we expect will grow earnings.
Please note, the market returns quoted in this article reflect the market weighted average returns of stocks that currently trade on Spanish exchanges.
Valuation is complex, but we're here to simplify it.
Discover if Naturgy Energy Group might be undervalued or overvalued with our detailed analysis, featuring fair value estimates, potential risks, dividends, insider trades, and its financial condition.
Access Free AnalysisHave feedback on this article? Concerned about the content? Get in touch with us directly. Alternatively, email editorial-team (at) simplywallst.com.
This article by Simply Wall St is general in nature. We provide commentary based on historical data and analyst forecasts only using an unbiased methodology and our articles are not intended to be financial advice. It does not constitute a recommendation to buy or sell any stock, and does not take account of your objectives, or your financial situation. We aim to bring you long-term focused analysis driven by fundamental data. Note that our analysis may not factor in the latest price-sensitive company announcements or qualitative material. Simply Wall St has no position in any stocks mentioned.
About BME:NTGY
Naturgy Energy Group
Engages in the supply, liquefaction, regasification, transport, storage, distribution, and sale of gas.
Established dividend payer and fair value.
Similar Companies
Market Insights

Community Narratives
