
Advertisement
- Spain
- /
- Electric Utilities
- /
- BME:ANA
The five-year decline in earnings might be taking its toll on Acciona (BME:ANA) shareholders as stock falls 4.3% over the past week

The simplest way to invest in stocks is to buy exchange traded funds. But in our experience, buying the right stocks can give your wealth a significant boost. For example, the Acciona, S.A. (BME:ANA) share price is up 30% in the last five years, slightly above the market return. The 3.7% share price rise over the last year is decent, but not great.
While this past week has detracted from the company's five-year return, let's look at the recent trends of the underlying business and see if the gains have been in alignment.
Check out our latest analysis for Acciona
To quote Buffett, 'Ships will sail around the world but the Flat Earth Society will flourish. There will continue to be wide discrepancies between price and value in the marketplace...' One imperfect but simple way to consider how the market perception of a company has shifted is to compare the change in the earnings per share (EPS) with the share price movement.
During five years of share price growth, Acciona actually saw its EPS drop 8.5% per year.
This means it's unlikely the market is judging the company based on earnings growth. Since the change in EPS doesn't seem to correlate with the change in share price, it's worth taking a look at other metrics.
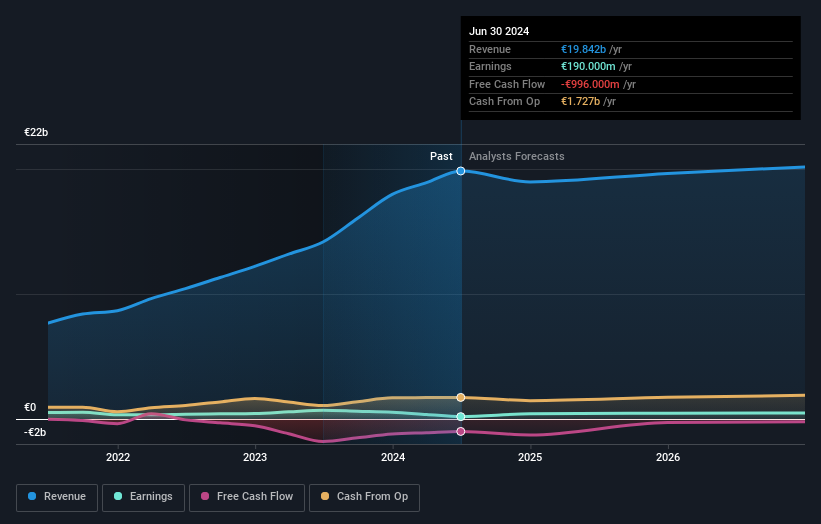
In contrast revenue growth of 22% per year is probably viewed as evidence that Acciona is growing, a real positive. In that case, the company may be sacrificing current earnings per share to drive growth.
You can see below how earnings and revenue have changed over time (discover the exact values by clicking on the image).
You can see how its balance sheet has strengthened (or weakened) over time in this free interactive graphic.
What About Dividends?
When looking at investment returns, it is important to consider the difference between total shareholder return (TSR) and share price return. The TSR incorporates the value of any spin-offs or discounted capital raisings, along with any dividends, based on the assumption that the dividends are reinvested. Arguably, the TSR gives a more comprehensive picture of the return generated by a stock. As it happens, Acciona's TSR for the last 5 years was 47%, which exceeds the share price return mentioned earlier. This is largely a result of its dividend payments!
A Different Perspective
Acciona provided a TSR of 7.5% over the last twelve months. But that was short of the market average. On the bright side, the longer term returns (running at about 8% a year, over half a decade) look better. It's quite possible the business continues to execute with prowess, even as the share price gains are slowing. It's always interesting to track share price performance over the longer term. But to understand Acciona better, we need to consider many other factors. Case in point: We've spotted 3 warning signs for Acciona you should be aware of, and 2 of them can't be ignored.
Of course, you might find a fantastic investment by looking elsewhere. So take a peek at this free list of companies we expect will grow earnings.
Please note, the market returns quoted in this article reflect the market weighted average returns of stocks that currently trade on Spanish exchanges.
New: Manage All Your Stock Portfolios in One Place
We've created the ultimate portfolio companion for stock investors, and it's free.
• Connect an unlimited number of Portfolios and see your total in one currency
• Be alerted to new Warning Signs or Risks via email or mobile
• Track the Fair Value of your stocks
Have feedback on this article? Concerned about the content? Get in touch with us directly. Alternatively, email editorial-team (at) simplywallst.com.
This article by Simply Wall St is general in nature. We provide commentary based on historical data and analyst forecasts only using an unbiased methodology and our articles are not intended to be financial advice. It does not constitute a recommendation to buy or sell any stock, and does not take account of your objectives, or your financial situation. We aim to bring you long-term focused analysis driven by fundamental data. Note that our analysis may not factor in the latest price-sensitive company announcements or qualitative material. Simply Wall St has no position in any stocks mentioned.
About BME:ANA
Acciona
Engages in the energy, infrastructure, and other businesses in Spain and internationally.
Moderate second-rate dividend payer.
Similar Companies
Market Insights

Advertisement
Community Narratives
RIO is poised to weather a depressed iron ore environment, but commodity diversification comes with lower margins
Fair Value AU$110.51|4.0% overvalued
DU
Community Contributor
The demand for personalized medicine will keep Thermo Fisher Scientific thriving
Fair Value US$540.27|21.0% undervalued
UN
Community Contributor
Silver Play by A Family with 10x Potential
Fair Value UK£24.00|88.7% undervalued
RO
Community Contributor