- Spain
- /
- Professional Services
- /
- BME:CLE
Returns On Capital At Clever Global (BME:CLE) Paint An Interesting Picture

If you're not sure where to start when looking for the next multi-bagger, there are a few key trends you should keep an eye out for. One common approach is to try and find a company with returns on capital employed (ROCE) that are increasing, in conjunction with a growing amount of capital employed. Ultimately, this demonstrates that it's a business that is reinvesting profits at increasing rates of return. However, after briefly looking over the numbers, we don't think Clever Global (BME:CLE) has the makings of a multi-bagger going forward, but let's have a look at why that may be.
Understanding Return On Capital Employed (ROCE)
Just to clarify if you're unsure, ROCE is a metric for evaluating how much pre-tax income (in percentage terms) a company earns on the capital invested in its business. The formula for this calculation on Clever Global is:
Return on Capital Employed = Earnings Before Interest and Tax (EBIT) ÷ (Total Assets - Current Liabilities)
0.02 = €232k ÷ (€16m - €4.5m) (Based on the trailing twelve months to June 2020).
So, Clever Global has an ROCE of 2.0%. Ultimately, that's a low return and it under-performs the IT industry average of 12%.
See our latest analysis for Clever Global
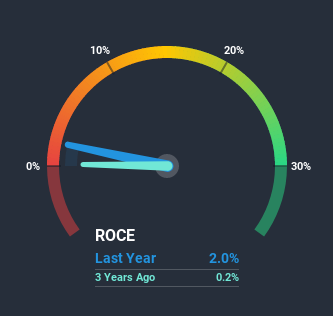
Historical performance is a great place to start when researching a stock so above you can see the gauge for Clever Global's ROCE against it's prior returns. If you're interested in investigating Clever Global's past further, check out this free graph of past earnings, revenue and cash flow.
What Can We Tell From Clever Global's ROCE Trend?
Unfortunately, the trend isn't great with ROCE falling from 19% five years ago, while capital employed has grown 154%. Usually this isn't ideal, but given Clever Global conducted a capital raising before their most recent earnings announcement, that would've likely contributed, at least partially, to the increased capital employed figure. It's unlikely that all of the funds raised have been put to work yet, so as a consequence Clever Global might not have received a full period of earnings contribution from it.
In Conclusion...
From the above analysis, we find it rather worrisome that returns on capital and sales for Clever Global have fallen, meanwhile the business is employing more capital than it was five years ago. Investors haven't taken kindly to these developments, since the stock has declined 67% from where it was three years ago. With underlying trends that aren't great in these areas, we'd consider looking elsewhere.
On a separate note, we've found 3 warning signs for Clever Global you'll probably want to know about.
While Clever Global isn't earning the highest return, check out this free list of companies that are earning high returns on equity with solid balance sheets.
If you decide to trade Clever Global, use the lowest-cost* platform that is rated #1 Overall by Barron’s, Interactive Brokers. Trade stocks, options, futures, forex, bonds and funds on 135 markets, all from a single integrated account. Promoted
The New Payments ETF Is Live on NASDAQ:
Money is moving to real-time rails, and a newly listed ETF now gives investors direct exposure. Fast settlement. Institutional custody. Simple access.
Explore how this launch could reshape portfolios
Sponsored ContentNew: AI Stock Screener & Alerts
Our new AI Stock Screener scans the market every day to uncover opportunities.
• Dividend Powerhouses (3%+ Yield)
• Undervalued Small Caps with Insider Buying
• High growth Tech and AI Companies
Or build your own from over 50 metrics.
This article by Simply Wall St is general in nature. It does not constitute a recommendation to buy or sell any stock, and does not take account of your objectives, or your financial situation. We aim to bring you long-term focused analysis driven by fundamental data. Note that our analysis may not factor in the latest price-sensitive company announcements or qualitative material. Simply Wall St has no position in any stocks mentioned.
*Interactive Brokers Rated Lowest Cost Broker by StockBrokers.com Annual Online Review 2020
Have feedback on this article? Concerned about the content? Get in touch with us directly. Alternatively, email editorial-team@simplywallst.com.
About BME:CLE
Good value with imperfect balance sheet.
Market Insights

Weekly Picks

THE KINGDOM OF BROWN GOODS: WHY MGPI IS BEING CRUSHED BY INVENTORY & PRIMED FOR RESURRECTION


Why Vertical Aerospace (NYSE: EVTL) is Worth Possibly Over 13x its Current Price


The Quiet Giant That Became AI’s Power Grid
Recently Updated Narratives

Deep Value Multi Bagger Opportunity


A case for CA$31.80 (undiluted), aka 8,616% upside from CA$0.37 (an 86 bagger!).


Unicycive Therapeutics (Nasdaq: UNCY) – Preparing for a Second Shot at Bringing a New Kidney Treatment to Market (TEST)
Popular Narratives


MicroVision will explode future revenue by 380.37% with a vision towards success


NVDA: Expanding AI Demand Will Drive Major Data Center Investments Through 2026


Crazy Undervalued 42 Baggers Silver Play (Active & Running Mine)
Trending Discussion

