
Advertisement
Mapfre, S.A.'s (BME:MAP) Stock's On An Uptrend: Are Strong Financials Guiding The Market?
Mapfre (BME:MAP) has had a great run on the share market with its stock up by a significant 12% over the last three months. Given that the market rewards strong financials in the long-term, we wonder if that is the case in this instance. In this article, we decided to focus on Mapfre's ROE.
Return on Equity or ROE is a test of how effectively a company is growing its value and managing investors’ money. In simpler terms, it measures the profitability of a company in relation to shareholder's equity.
See our latest analysis for Mapfre
How To Calculate Return On Equity?
The formula for return on equity is:
Return on Equity = Net Profit (from continuing operations) ÷ Shareholders' Equity
So, based on the above formula, the ROE for Mapfre is:
15% = €1.5b ÷ €9.7b (Based on the trailing twelve months to June 2024).
The 'return' is the profit over the last twelve months. Another way to think of that is that for every €1 worth of equity, the company was able to earn €0.15 in profit.
What Has ROE Got To Do With Earnings Growth?
So far, we've learned that ROE is a measure of a company's profitability. Depending on how much of these profits the company reinvests or "retains", and how effectively it does so, we are then able to assess a company’s earnings growth potential. Assuming all else is equal, companies that have both a higher return on equity and higher profit retention are usually the ones that have a higher growth rate when compared to companies that don't have the same features.
A Side By Side comparison of Mapfre's Earnings Growth And 15% ROE
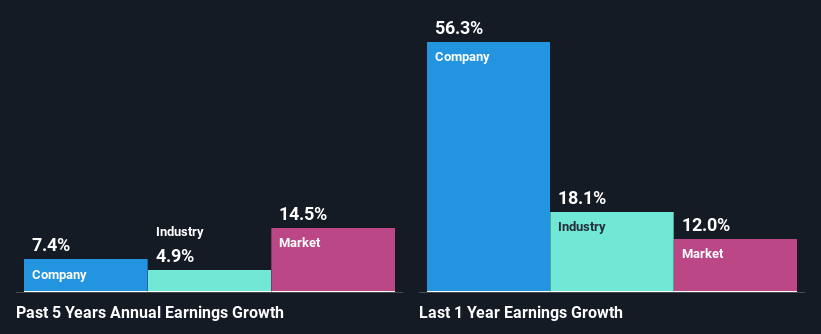
At first glance, Mapfre seems to have a decent ROE. Further, the company's ROE is similar to the industry average of 13%. Consequently, this likely laid the ground for the decent growth of 7.4% seen over the past five years by Mapfre.
As a next step, we compared Mapfre's net income growth with the industry, and pleasingly, we found that the growth seen by the company is higher than the average industry growth of 4.9%.
Earnings growth is a huge factor in stock valuation. The investor should try to establish if the expected growth or decline in earnings, whichever the case may be, is priced in. This then helps them determine if the stock is placed for a bright or bleak future. Has the market priced in the future outlook for MAP? You can find out in our latest intrinsic value infographic research report.
Is Mapfre Using Its Retained Earnings Effectively?
Mapfre has a significant three-year median payout ratio of 64%, meaning that it is left with only 36% to reinvest into its business. This implies that the company has been able to achieve decent earnings growth despite returning most of its profits to shareholders.
Moreover, Mapfre is determined to keep sharing its profits with shareholders which we infer from its long history of paying a dividend for at least ten years. Based on the latest analysts' estimates, we found that the company's future payout ratio over the next three years is expected to hold steady at 56%. Still, forecasts suggest that Mapfre's future ROE will drop to 10% even though the the company's payout ratio is not expected to change by much.
Conclusion
On the whole, we feel that Mapfre's performance has been quite good. Especially the high ROE, Which has contributed to the impressive growth seen in earnings. Despite the company reinvesting only a small portion of its profits, it still has managed to grow its earnings so that is appreciable. With that said, the latest industry analyst forecasts reveal that the company's earnings growth is expected to slow down. Are these analysts expectations based on the broad expectations for the industry, or on the company's fundamentals? Click here to be taken to our analyst's forecasts page for the company.
New: Manage All Your Stock Portfolios in One Place
We've created the ultimate portfolio companion for stock investors, and it's free.
• Connect an unlimited number of Portfolios and see your total in one currency
• Be alerted to new Warning Signs or Risks via email or mobile
• Track the Fair Value of your stocks
Have feedback on this article? Concerned about the content? Get in touch with us directly. Alternatively, email editorial-team (at) simplywallst.com.
This article by Simply Wall St is general in nature. We provide commentary based on historical data and analyst forecasts only using an unbiased methodology and our articles are not intended to be financial advice. It does not constitute a recommendation to buy or sell any stock, and does not take account of your objectives, or your financial situation. We aim to bring you long-term focused analysis driven by fundamental data. Note that our analysis may not factor in the latest price-sensitive company announcements or qualitative material. Simply Wall St has no position in any stocks mentioned.
About BME:MAP
Mapfre
Engages in the investment, insurance, property, financial, and services businesses in Spain.
Undervalued with solid track record and pays a dividend.
Market Insights

Advertisement
Community Narratives
Finding The True Value Of A Logistics Powerhouse
Fair Value US$95.21|8.5% undervalued
NV
Community Contributor
Paradigm Biopharmaceuticals Will Lead Osteoarthritis Treatment with Zilosul's FDA Success
Fair Value AU$5.50|91.9% undervalued
AM
Community Contributor
Barrick Mining (ABX:CA): A Gold Hedge against a U.S. Shutdown
Fair Value CA$60.00|26.5% undervalued
GM
Community Contributor