

Did you know there are some financial metrics that can provide clues of a potential multi-bagger? Ideally, a business will show two trends; firstly a growing return on capital employed (ROCE) and secondly, an increasing amount of capital employed. This shows us that it's a compounding machine, able to continually reinvest its earnings back into the business and generate higher returns. So when we looked at Ferrovial (BME:FER) and its trend of ROCE, we really liked what we saw.
Understanding Return On Capital Employed (ROCE)
If you haven't worked with ROCE before, it measures the 'return' (pre-tax profit) a company generates from capital employed in its business. Analysts use this formula to calculate it for Ferrovial:
Return on Capital Employed = Earnings Before Interest and Tax (EBIT) ÷ (Total Assets - Current Liabilities)
0.029 = €590m ÷ (€26b - €5.8b) (Based on the trailing twelve months to December 2023).
Therefore, Ferrovial has an ROCE of 2.9%. Ultimately, that's a low return and it under-performs the Construction industry average of 8.1%.
Check out our latest analysis for Ferrovial
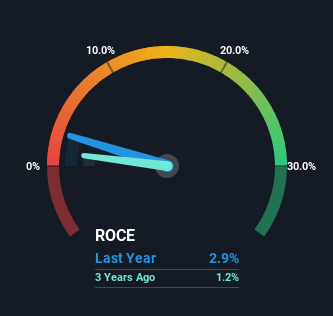
Above you can see how the current ROCE for Ferrovial compares to its prior returns on capital, but there's only so much you can tell from the past. If you'd like, you can check out the forecasts from the analysts covering Ferrovial for free.
So How Is Ferrovial's ROCE Trending?
We're glad to see that ROCE is heading in the right direction, even if it is still low at the moment. The data shows that returns on capital have increased substantially over the last five years to 2.9%. The company is effectively making more money per dollar of capital used, and it's worth noting that the amount of capital has increased too, by 32%. So we're very much inspired by what we're seeing at Ferrovial thanks to its ability to profitably reinvest capital.
On a related note, the company's ratio of current liabilities to total assets has decreased to 22%, which basically reduces it's funding from the likes of short-term creditors or suppliers. This tells us that Ferrovial has grown its returns without a reliance on increasing their current liabilities, which we're very happy with.
The Key Takeaway
In summary, it's great to see that Ferrovial can compound returns by consistently reinvesting capital at increasing rates of return, because these are some of the key ingredients of those highly sought after multi-baggers. Since the stock has returned a solid 83% to shareholders over the last five years, it's fair to say investors are beginning to recognize these changes. So given the stock has proven it has promising trends, it's worth researching the company further to see if these trends are likely to persist.
If you want to know some of the risks facing Ferrovial we've found 2 warning signs (1 makes us a bit uncomfortable!) that you should be aware of before investing here.
While Ferrovial may not currently earn the highest returns, we've compiled a list of companies that currently earn more than 25% return on equity. Check out this free list here.
New: AI Stock Screener & Alerts
Our new AI Stock Screener scans the market every day to uncover opportunities.
• Dividend Powerhouses (3%+ Yield)
• Undervalued Small Caps with Insider Buying
• High growth Tech and AI Companies
Or build your own from over 50 metrics.
Have feedback on this article? Concerned about the content? Get in touch with us directly. Alternatively, email editorial-team (at) simplywallst.com.
This article by Simply Wall St is general in nature. We provide commentary based on historical data and analyst forecasts only using an unbiased methodology and our articles are not intended to be financial advice. It does not constitute a recommendation to buy or sell any stock, and does not take account of your objectives, or your financial situation. We aim to bring you long-term focused analysis driven by fundamental data. Note that our analysis may not factor in the latest price-sensitive company announcements or qualitative material. Simply Wall St has no position in any stocks mentioned.
About BME:FER
Ferrovial
Engages in the design, construction, financing, operation, and maintenance of transport infrastructure and urban services internationally.
Solid track record unattractive dividend payer.
Similar Companies
Market Insights

Community Narratives


