- Spain
- /
- Electrical
- /
- BME:EIDF
Energía, Innovación y Desarrollo Fotovoltaico, S.A.'s (BME:EIDF) Share Price Is Still Matching Investor Opinion Despite 41% Slump


The Energía, Innovación y Desarrollo Fotovoltaico, S.A. (BME:EIDF) share price has softened a substantial 41% over the previous 30 days, handing back much of the gains the stock has made lately. The recent drop completes a disastrous twelve months for shareholders, who are sitting on a 77% loss during that time.
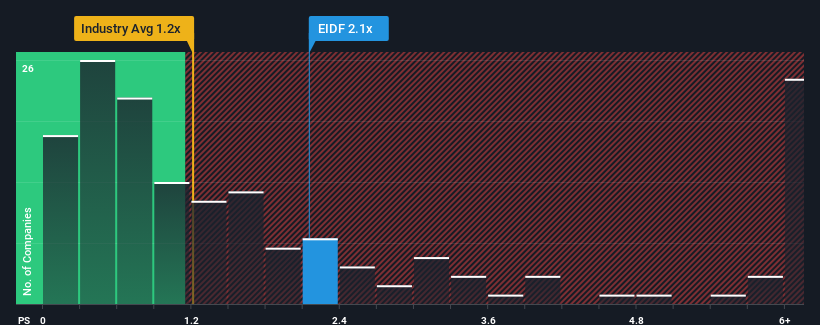
In spite of the heavy fall in price, given close to half the companies operating in Spain's Electrical industry have price-to-sales ratios (or "P/S") below 0.7x, you may still consider Energía Innovación y Desarrollo Fotovoltaico as a stock to potentially avoid with its 2.1x P/S ratio. However, the P/S might be high for a reason and it requires further investigation to determine if it's justified.
See our latest analysis for Energía Innovación y Desarrollo Fotovoltaico
What Does Energía Innovación y Desarrollo Fotovoltaico's P/S Mean For Shareholders?
As an illustration, revenue has deteriorated at Energía Innovación y Desarrollo Fotovoltaico over the last year, which is not ideal at all. One possibility is that the P/S is high because investors think the company will still do enough to outperform the broader industry in the near future. However, if this isn't the case, investors might get caught out paying too much for the stock.
Want the full picture on earnings, revenue and cash flow for the company? Then our free report on Energía Innovación y Desarrollo Fotovoltaico will help you shine a light on its historical performance.Is There Enough Revenue Growth Forecasted For Energía Innovación y Desarrollo Fotovoltaico?
In order to justify its P/S ratio, Energía Innovación y Desarrollo Fotovoltaico would need to produce impressive growth in excess of the industry.
In reviewing the last year of financials, we were disheartened to see the company's revenues fell to the tune of 37%. Spectacularly, three year revenue growth has ballooned by several orders of magnitude, despite the drawbacks experienced in the last 12 months. Accordingly, shareholders will be pleased, but also have some serious questions to ponder about the last 12 months.
This is in contrast to the rest of the industry, which is expected to grow by 11% over the next year, materially lower than the company's recent medium-term annualised growth rates.
In light of this, it's understandable that Energía Innovación y Desarrollo Fotovoltaico's P/S sits above the majority of other companies. It seems most investors are expecting this strong growth to continue and are willing to pay more for the stock.
The Key Takeaway
Despite the recent share price weakness, Energía Innovación y Desarrollo Fotovoltaico's P/S remains higher than most other companies in the industry. Generally, our preference is to limit the use of the price-to-sales ratio to establishing what the market thinks about the overall health of a company.
As we suspected, our examination of Energía Innovación y Desarrollo Fotovoltaico revealed its three-year revenue trends are contributing to its high P/S, given they look better than current industry expectations. In the eyes of shareholders, the probability of a continued growth trajectory is great enough to prevent the P/S from pulling back. If recent medium-term revenue trends continue, it's hard to see the share price falling strongly in the near future under these circumstances.
You need to take note of risks, for example - Energía Innovación y Desarrollo Fotovoltaico has 4 warning signs (and 3 which are a bit concerning) we think you should know about.
If strong companies turning a profit tickle your fancy, then you'll want to check out this free list of interesting companies that trade on a low P/E (but have proven they can grow earnings).
Valuation is complex, but we're here to simplify it.
Discover if Energía Innovación y Desarrollo Fotovoltaico might be undervalued or overvalued with our detailed analysis, featuring fair value estimates, potential risks, dividends, insider trades, and its financial condition.
Access Free AnalysisHave feedback on this article? Concerned about the content? Get in touch with us directly. Alternatively, email editorial-team (at) simplywallst.com.
This article by Simply Wall St is general in nature. We provide commentary based on historical data and analyst forecasts only using an unbiased methodology and our articles are not intended to be financial advice. It does not constitute a recommendation to buy or sell any stock, and does not take account of your objectives, or your financial situation. We aim to bring you long-term focused analysis driven by fundamental data. Note that our analysis may not factor in the latest price-sensitive company announcements or qualitative material. Simply Wall St has no position in any stocks mentioned.
About BME:EIDF
Energía Innovación y Desarrollo Fotovoltaico
Energía, Innovación y Desarrollo Fotovoltaico, S.A.
Low with imperfect balance sheet.
Similar Companies
Market Insights

Community Narratives
