
Legendary fund manager Li Lu (who Charlie Munger backed) once said, 'The biggest investment risk is not the volatility of prices, but whether you will suffer a permanent loss of capital.' So it seems the smart money knows that debt - which is usually involved in bankruptcies - is a very important factor, when you assess how risky a company is. We can see that SP Group A/S (CPH:SPG) does use debt in its business. But the real question is whether this debt is making the company risky.
When Is Debt Dangerous?
Generally speaking, debt only becomes a real problem when a company can't easily pay it off, either by raising capital or with its own cash flow. If things get really bad, the lenders can take control of the business. However, a more usual (but still expensive) situation is where a company must dilute shareholders at a cheap share price simply to get debt under control. Of course, debt can be an important tool in businesses, particularly capital heavy businesses. The first step when considering a company's debt levels is to consider its cash and debt together.
Check out our latest analysis for SP Group
How Much Debt Does SP Group Carry?
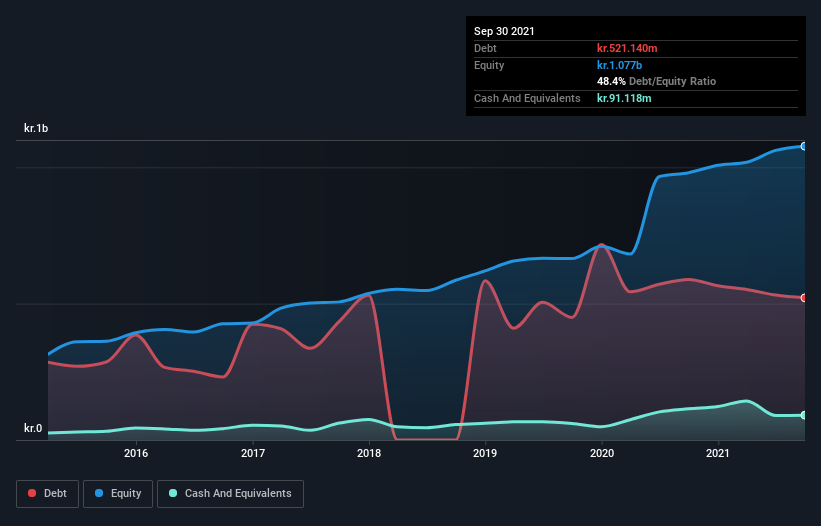
As you can see below, SP Group had kr.521.1m of debt at September 2021, down from kr.588.9m a year prior. However, because it has a cash reserve of kr.91.1m, its net debt is less, at about kr.430.0m.
How Healthy Is SP Group's Balance Sheet?
According to the last reported balance sheet, SP Group had liabilities of kr.812.6m due within 12 months, and liabilities of kr.521.1m due beyond 12 months. Offsetting these obligations, it had cash of kr.91.1m as well as receivables valued at kr.385.3m due within 12 months. So its liabilities total kr.857.4m more than the combination of its cash and short-term receivables.
Of course, SP Group has a market capitalization of kr.4.60b, so these liabilities are probably manageable. Having said that, it's clear that we should continue to monitor its balance sheet, lest it change for the worse.
We use two main ratios to inform us about debt levels relative to earnings. The first is net debt divided by earnings before interest, tax, depreciation, and amortization (EBITDA), while the second is how many times its earnings before interest and tax (EBIT) covers its interest expense (or its interest cover, for short). Thus we consider debt relative to earnings both with and without depreciation and amortization expenses.
SP Group has a low net debt to EBITDA ratio of only 1.2. And its EBIT covers its interest expense a whopping 10.1 times over. So we're pretty relaxed about its super-conservative use of debt. On top of that, SP Group grew its EBIT by 40% over the last twelve months, and that growth will make it easier to handle its debt. The balance sheet is clearly the area to focus on when you are analysing debt. But ultimately the future profitability of the business will decide if SP Group can strengthen its balance sheet over time. So if you're focused on the future you can check out this free report showing analyst profit forecasts.
Finally, a business needs free cash flow to pay off debt; accounting profits just don't cut it. So we clearly need to look at whether that EBIT is leading to corresponding free cash flow. In the last three years, SP Group's free cash flow amounted to 34% of its EBIT, less than we'd expect. That weak cash conversion makes it more difficult to handle indebtedness.
Our View
The good news is that SP Group's demonstrated ability to grow its EBIT delights us like a fluffy puppy does a toddler. But, on a more sombre note, we are a little concerned by its conversion of EBIT to free cash flow. When we consider the range of factors above, it looks like SP Group is pretty sensible with its use of debt. While that brings some risk, it can also enhance returns for shareholders. When analysing debt levels, the balance sheet is the obvious place to start. However, not all investment risk resides within the balance sheet - far from it. Be aware that SP Group is showing 1 warning sign in our investment analysis , you should know about...
At the end of the day, it's often better to focus on companies that are free from net debt. You can access our special list of such companies (all with a track record of profit growth). It's free.
The New Payments ETF Is Live on NASDAQ:
Money is moving to real-time rails, and a newly listed ETF now gives investors direct exposure. Fast settlement. Institutional custody. Simple access.
Explore how this launch could reshape portfolios
Sponsored ContentNew: Manage All Your Stock Portfolios in One Place
We've created the ultimate portfolio companion for stock investors, and it's free.
• Connect an unlimited number of Portfolios and see your total in one currency
• Be alerted to new Warning Signs or Risks via email or mobile
• Track the Fair Value of your stocks
Have feedback on this article? Concerned about the content? Get in touch with us directly. Alternatively, email editorial-team (at) simplywallst.com.
This article by Simply Wall St is general in nature. We provide commentary based on historical data and analyst forecasts only using an unbiased methodology and our articles are not intended to be financial advice. It does not constitute a recommendation to buy or sell any stock, and does not take account of your objectives, or your financial situation. We aim to bring you long-term focused analysis driven by fundamental data. Note that our analysis may not factor in the latest price-sensitive company announcements or qualitative material. Simply Wall St has no position in any stocks mentioned.
About CPSE:SPG
SP Group
Manufactures and sells moulded plastic and composite components in Denmark, rest of Europe, the Americas, Asia, the Middle East, Australia, and Africa.
Undervalued with excellent balance sheet.
Market Insights

Weekly Picks

THE KINGDOM OF BROWN GOODS: WHY MGPI IS BEING CRUSHED BY INVENTORY & PRIMED FOR RESURRECTION


Why Vertical Aerospace (NYSE: EVTL) is Worth Possibly Over 13x its Current Price


The Quiet Giant That Became AI’s Power Grid
Recently Updated Narratives

Butler National (Buks) outperforms.


A tech powerhouse quietly powering the world’s AI infrastructure.


Keppel DC REIT (SGX: AJBU) is a resilient gem in the data center space.
Popular Narratives

MicroVision will explode future revenue by 380.37% with a vision towards success


Crazy Undervalued 42 Baggers Silver Play (Active & Running Mine)


