
Advertisement
Royal Unibrew A/S (CPH:RBREW) Shares Could Be 45% Below Their Intrinsic Value Estimate
Key Insights
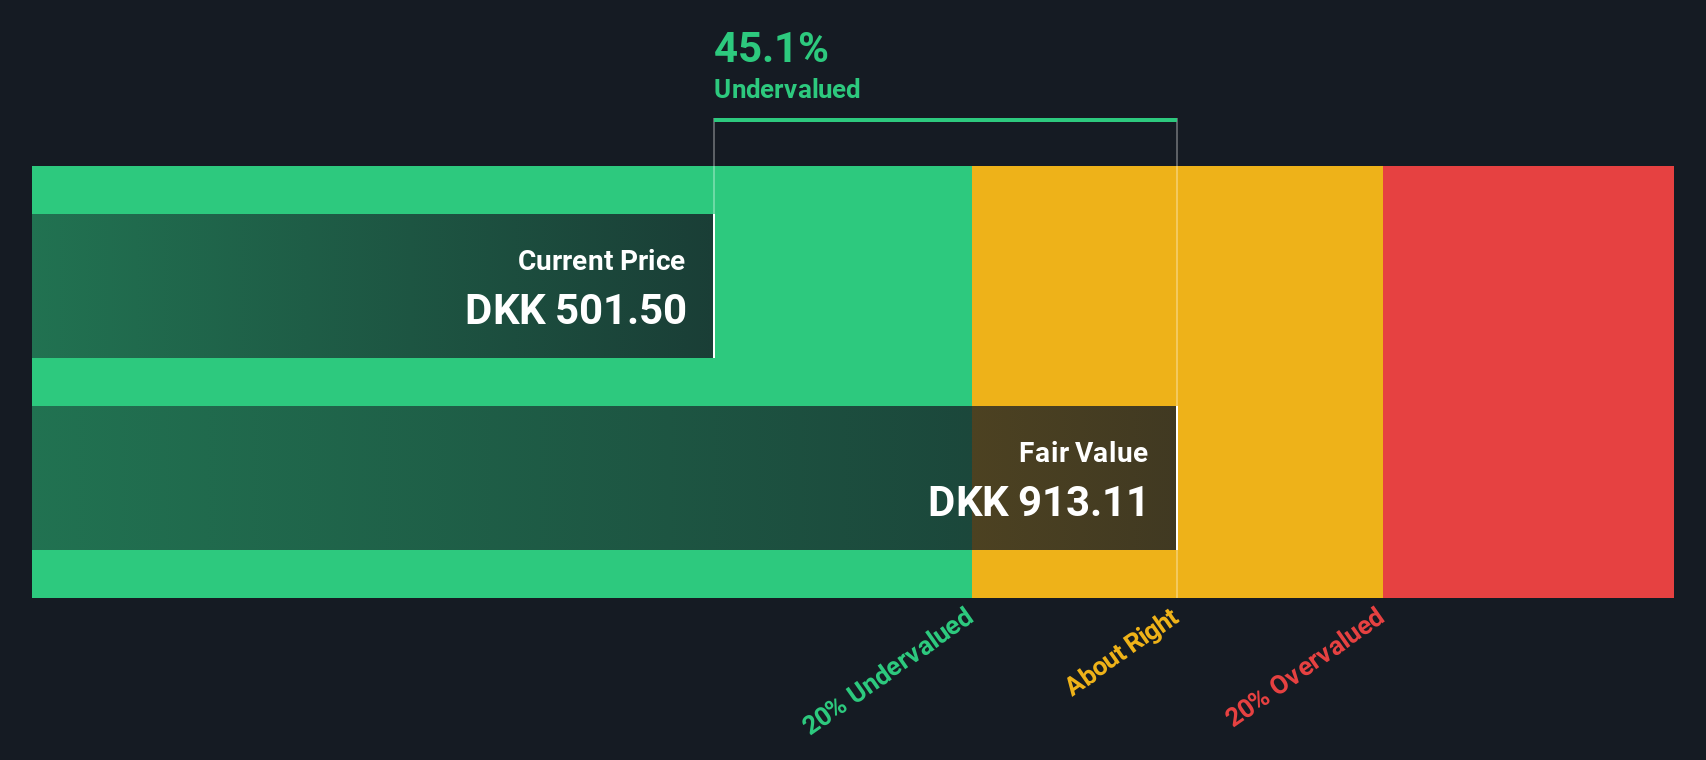
- Using the 2 Stage Free Cash Flow to Equity, Royal Unibrew fair value estimate is kr.913
- Royal Unibrew's kr.502 share price signals that it might be 45% undervalued
- Analyst price target for RBREW is kr.592 which is 35% below our fair value estimate
How far off is Royal Unibrew A/S (CPH:RBREW) from its intrinsic value? Using the most recent financial data, we'll take a look at whether the stock is fairly priced by taking the expected future cash flows and discounting them to their present value. This will be done using the Discounted Cash Flow (DCF) model. It may sound complicated, but actually it is quite simple!
Remember though, that there are many ways to estimate a company's value, and a DCF is just one method. If you still have some burning questions about this type of valuation, take a look at the Simply Wall St analysis model.
The Model
We use what is known as a 2-stage model, which simply means we have two different periods of growth rates for the company's cash flows. Generally the first stage is higher growth, and the second stage is a lower growth phase. To begin with, we have to get estimates of the next ten years of cash flows. Where possible we use analyst estimates, but when these aren't available we extrapolate the previous free cash flow (FCF) from the last estimate or reported value. We assume companies with shrinking free cash flow will slow their rate of shrinkage, and that companies with growing free cash flow will see their growth rate slow, over this period. We do this to reflect that growth tends to slow more in the early years than it does in later years.
A DCF is all about the idea that a dollar in the future is less valuable than a dollar today, and so the sum of these future cash flows is then discounted to today's value:
10-year free cash flow (FCF) estimate
| 2026 | 2027 | 2028 | 2029 | 2030 | 2031 | 2032 | 2033 | 2034 | 2035 | |
| Levered FCF (DKK, Millions) | kr.1.40b | kr.1.59b | kr.1.44b | kr.1.60b | kr.1.64b | kr.1.68b | kr.1.71b | kr.1.75b | kr.1.78b | kr.1.80b |
| Growth Rate Estimate Source | Analyst x7 | Analyst x7 | Analyst x1 | Analyst x1 | Est @ 2.58% | Est @ 2.24% | Est @ 2.00% | Est @ 1.83% | Est @ 1.71% | Est @ 1.63% |
| Present Value (DKK, Millions) Discounted @ 4.9% | kr.1.3k | kr.1.4k | kr.1.2k | kr.1.3k | kr.1.3k | kr.1.3k | kr.1.2k | kr.1.2k | kr.1.2k | kr.1.1k |
("Est" = FCF growth rate estimated by Simply Wall St)
Present Value of 10-year Cash Flow (PVCF) = kr.13b
We now need to calculate the Terminal Value, which accounts for all the future cash flows after this ten year period. For a number of reasons a very conservative growth rate is used that cannot exceed that of a country's GDP growth. In this case we have used the 5-year average of the 10-year government bond yield (1.4%) to estimate future growth. In the same way as with the 10-year 'growth' period, we discount future cash flows to today's value, using a cost of equity of 4.9%.
Terminal Value (TV)= FCF2035 × (1 + g) ÷ (r – g) = kr.1.8b× (1 + 1.4%) ÷ (4.9%– 1.4%) = kr.53b
Present Value of Terminal Value (PVTV)= TV / (1 + r)10= kr.53b÷ ( 1 + 4.9%)10= kr.33b
The total value is the sum of cash flows for the next ten years plus the discounted terminal value, which results in the Total Equity Value, which in this case is kr.45b. To get the intrinsic value per share, we divide this by the total number of shares outstanding. Compared to the current share price of kr.502, the company appears quite undervalued at a 45% discount to where the stock price trades currently. Valuations are imprecise instruments though, rather like a telescope - move a few degrees and end up in a different galaxy. Do keep this in mind.
The Assumptions
We would point out that the most important inputs to a discounted cash flow are the discount rate and of course the actual cash flows. If you don't agree with these result, have a go at the calculation yourself and play with the assumptions. The DCF also does not consider the possible cyclicality of an industry, or a company's future capital requirements, so it does not give a full picture of a company's potential performance. Given that we are looking at Royal Unibrew as potential shareholders, the cost of equity is used as the discount rate, rather than the cost of capital (or weighted average cost of capital, WACC) which accounts for debt. In this calculation we've used 4.9%, which is based on a levered beta of 0.800. Beta is a measure of a stock's volatility, compared to the market as a whole. We get our beta from the industry average beta of globally comparable companies, with an imposed limit between 0.8 and 2.0, which is a reasonable range for a stable business.
Check out our latest analysis for Royal Unibrew
SWOT Analysis for Royal Unibrew
Strength
- Earnings growth over the past year exceeded the industry.
- Debt is well covered by earnings and cashflows.
- Dividends are covered by earnings and cash flows.
Weakness
- Dividend is low compared to the top 25% of dividend payers in the Beverage market.
Opportunity
- Annual earnings are forecast to grow for the next 3 years.
- Trading below our estimate of fair value by more than 20%.
Threat
- Annual earnings are forecast to grow slower than the Danish market.
Next Steps:
Valuation is only one side of the coin in terms of building your investment thesis, and it ideally won't be the sole piece of analysis you scrutinize for a company. It's not possible to obtain a foolproof valuation with a DCF model. Rather it should be seen as a guide to "what assumptions need to be true for this stock to be under/overvalued?" If a company grows at a different rate, or if its cost of equity or risk free rate changes sharply, the output can look very different. What is the reason for the share price sitting below the intrinsic value? For Royal Unibrew, we've compiled three pertinent items you should explore:
- Risks: We feel that you should assess the 2 warning signs for Royal Unibrew we've flagged before making an investment in the company.
- Future Earnings: How does RBREW's growth rate compare to its peers and the wider market? Dig deeper into the analyst consensus number for the upcoming years by interacting with our free analyst growth expectation chart.
- Other High Quality Alternatives: Do you like a good all-rounder? Explore our interactive list of high quality stocks to get an idea of what else is out there you may be missing!
PS. The Simply Wall St app conducts a discounted cash flow valuation for every stock on the CPSE every day. If you want to find the calculation for other stocks just search here.
New: AI Stock Screener & Alerts
Our new AI Stock Screener scans the market every day to uncover opportunities.
• Dividend Powerhouses (3%+ Yield)
• Undervalued Small Caps with Insider Buying
• High growth Tech and AI Companies
Or build your own from over 50 metrics.
Have feedback on this article? Concerned about the content? Get in touch with us directly. Alternatively, email editorial-team (at) simplywallst.com.
This article by Simply Wall St is general in nature. We provide commentary based on historical data and analyst forecasts only using an unbiased methodology and our articles are not intended to be financial advice. It does not constitute a recommendation to buy or sell any stock, and does not take account of your objectives, or your financial situation. We aim to bring you long-term focused analysis driven by fundamental data. Note that our analysis may not factor in the latest price-sensitive company announcements or qualitative material. Simply Wall St has no position in any stocks mentioned.
About CPSE:RBREW
Royal Unibrew
Provides beer, soft drinks, malt beverages, energy drinks, cider/ready to drink, juice, water, and wine and spirits.
Undervalued with solid track record and pays a dividend.
Similar Companies
Market Insights


Advertisement
Community Narratives
America Wants Homegrown Drones — Draganfly Is Ready to Deliver
Fair Value US$9.21|33.9% undervalued
JO
Community Contributor
Cheesecake Factory offers an enticing opportunity for long-term growth by leveraging new concepts
Fair Value US$73.83|26.5% undervalued
ZW
Community Contributor
Coca-Cola’s Intrinsic Value Set to Rise with Fed Rate Cut
Fair Value US$67.50|2.3% undervalued
AL
Community Contributor
Fully Permitted Gold Mine with 50 Baggers Potential 
Fair Value CA$41.00|98.0% undervalued
RO
Community Contributor