
Advertisement
- Germany
- /
- Marine and Shipping
- /
- XTRA:HLAG
Revenues Not Telling The Story For Hapag-Lloyd Aktiengesellschaft (ETR:HLAG) After Shares Rise 32%
Hapag-Lloyd Aktiengesellschaft (ETR:HLAG) shareholders would be excited to see that the share price has had a great month, posting a 32% gain and recovering from prior weakness. Unfortunately, the gains of the last month did little to right the losses of the last year with the stock still down 43% over that time.
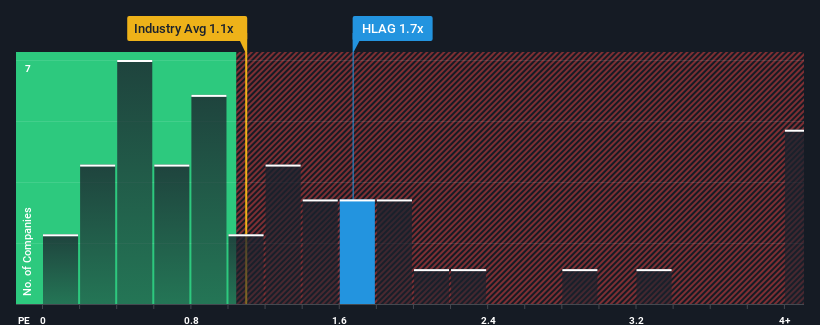
After such a large jump in price, when almost half of the companies in Germany's Shipping industry have price-to-sales ratios (or "P/S") below 1.1x, you may consider Hapag-Lloyd as a stock probably not worth researching with its 1.7x P/S ratio. However, the P/S might be high for a reason and it requires further investigation to determine if it's justified.
View our latest analysis for Hapag-Lloyd
What Does Hapag-Lloyd's P/S Mean For Shareholders?
Hapag-Lloyd has been struggling lately as its revenue has declined faster than most other companies. One possibility is that the P/S ratio is high because investors think the company will turn things around completely and accelerate past most others in the industry. If not, then existing shareholders may be very nervous about the viability of the share price.
If you'd like to see what analysts are forecasting going forward, you should check out our free report on Hapag-Lloyd.What Are Revenue Growth Metrics Telling Us About The High P/S?
Hapag-Lloyd's P/S ratio would be typical for a company that's expected to deliver solid growth, and importantly, perform better than the industry.
Taking a look back first, the company's revenue growth last year wasn't something to get excited about as it posted a disappointing decline of 48%. However, a few very strong years before that means that it was still able to grow revenue by an impressive 40% in total over the last three years. So we can start by confirming that the company has generally done a very good job of growing revenue over that time, even though it had some hiccups along the way.
Looking ahead now, revenue is anticipated to slump, contracting by 3.3% per year during the coming three years according to the ten analysts following the company. Meanwhile, the broader industry is forecast to expand by 1.0% each year, which paints a poor picture.
With this in mind, we find it intriguing that Hapag-Lloyd's P/S is closely matching its industry peers. Apparently many investors in the company reject the analyst cohort's pessimism and aren't willing to let go of their stock at any price. Only the boldest would assume these prices are sustainable as these declining revenues are likely to weigh heavily on the share price eventually.
The Key Takeaway
Hapag-Lloyd shares have taken a big step in a northerly direction, but its P/S is elevated as a result. It's argued the price-to-sales ratio is an inferior measure of value within certain industries, but it can be a powerful business sentiment indicator.
For a company with revenues that are set to decline in the context of a growing industry, Hapag-Lloyd's P/S is much higher than we would've anticipated. In cases like this where we see revenue decline on the horizon, we suspect the share price is at risk of following suit, bringing back the high P/S into the realms of suitability. At these price levels, investors should remain cautious, particularly if things don't improve.
And what about other risks? Every company has them, and we've spotted 4 warning signs for Hapag-Lloyd (of which 1 doesn't sit too well with us!) you should know about.
It's important to make sure you look for a great company, not just the first idea you come across. So if growing profitability aligns with your idea of a great company, take a peek at this free list of interesting companies with strong recent earnings growth (and a low P/E).
Valuation is complex, but we're here to simplify it.
Discover if Hapag-Lloyd might be undervalued or overvalued with our detailed analysis, featuring fair value estimates, potential risks, dividends, insider trades, and its financial condition.
Access Free AnalysisHave feedback on this article? Concerned about the content? Get in touch with us directly. Alternatively, email editorial-team (at) simplywallst.com.
This article by Simply Wall St is general in nature. We provide commentary based on historical data and analyst forecasts only using an unbiased methodology and our articles are not intended to be financial advice. It does not constitute a recommendation to buy or sell any stock, and does not take account of your objectives, or your financial situation. We aim to bring you long-term focused analysis driven by fundamental data. Note that our analysis may not factor in the latest price-sensitive company announcements or qualitative material. Simply Wall St has no position in any stocks mentioned.
About XTRA:HLAG
Flawless balance sheet with acceptable track record.
Similar Companies
Market Insights

Advertisement
Weekly Picks
RO


RockeTeller on Santacruz Silver Mining ·
Crazy Undervalued 42 Baggers Silver Play (Active & Running Mine)
Fair Value:CA$8696.7% undervalued
13 followersusers have followed this narrative
5 commentsusers have commented on this narrative
1 likeusers have liked this narrative
RO


Robbo on Fiducian Group ·
Fiducian: Compliance Clouds or Value Opportunity?
Fair Value:AU$126.1% undervalued
2 followersusers have followed this narrative
0 commentsusers have commented on this narrative
0 likesusers have liked this narrative
WO

woodworthfund on Willamette Valley Vineyards ·
Willamette Valley Vineyards (WVVI): Not-So-Great Value
Fair Value:US$242.5% overvalued
2 followersusers have followed this narrative
0 commentsusers have commented on this narrative
1 likeusers have liked this narrative
Recently Updated Narratives
YE
Yellow_fever on China Starch Holdings ·
China Starch Holdings eyes a revenue growth of 4.66% with a 5-year strategic plan
Fair Value:HK$0.562.8% undervalued
1 followerusers have followed this narrative
0 commentsusers have commented on this narrative
0 likesusers have liked this narrative
CO

composite32 on Power Solutions International ·
PSIX The timing of insider sales is a serious question mark
Fair Value:US$37.3845.7% overvalued
1 followerusers have followed this narrative
0 commentsusers have commented on this narrative
0 likesusers have liked this narrative
TA


Talos on Marvell Technology ·
The Great Strategy Swap – Selling "Old Auto" to Buy "Future Light"
Fair Value:US$155.3740.2% undervalued
1 followerusers have followed this narrative
0 commentsusers have commented on this narrative
0 likesusers have liked this narrative
Popular Narratives
TH


TheWallstreetKing on MicroVision ·
MicroVision will explode future revenue by 380.37% with a vision towards success
Fair Value:US$6098.6% undervalued
112 followersusers have followed this narrative
11 commentsusers have commented on this narrative
22 likesusers have liked this narrative
AN


AnalystConsensusTarget on NVIDIA ·
NVDA: Expanding AI Demand Will Drive Major Data Center Investments Through 2026
Fair Value:US$250.3927.5% undervalued
947 followersusers have followed this narrative
6 commentsusers have commented on this narrative
24 likesusers have liked this narrative
OS


oscargarcia on Alphabet ·
The company that turned a verb into a global necessity and basically runs the modern internet, digital ads, smartphones, maps, and AI.
Fair Value:US$3407.1% undervalued
148 followersusers have followed this narrative
6 commentsusers have commented on this narrative
18 likesusers have liked this narrative

