

Legendary fund manager Li Lu (who Charlie Munger backed) once said, 'The biggest investment risk is not the volatility of prices, but whether you will suffer a permanent loss of capital.' So it seems the smart money knows that debt - which is usually involved in bankruptcies - is a very important factor, when you assess how risky a company is. We can see that Fraport AG (ETR:FRA) does use debt in its business. But is this debt a concern to shareholders?
When Is Debt A Problem?
Debt assists a business until the business has trouble paying it off, either with new capital or with free cash flow. Part and parcel of capitalism is the process of 'creative destruction' where failed businesses are mercilessly liquidated by their bankers. However, a more common (but still painful) scenario is that it has to raise new equity capital at a low price, thus permanently diluting shareholders. Of course, the upside of debt is that it often represents cheap capital, especially when it replaces dilution in a company with the ability to reinvest at high rates of return. The first thing to do when considering how much debt a business uses is to look at its cash and debt together.
Check out our latest analysis for Fraport
What Is Fraport's Net Debt?
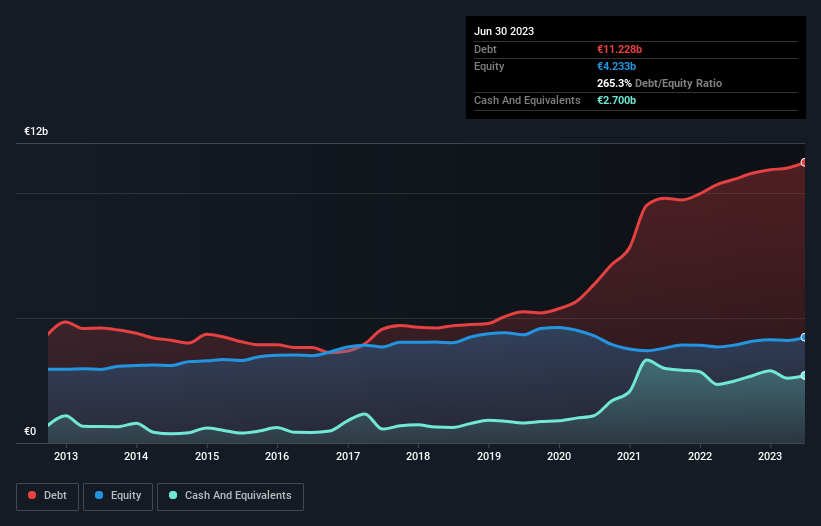
The image below, which you can click on for greater detail, shows that at June 2023 Fraport had debt of €11.2b, up from €10.6b in one year. However, it does have €2.70b in cash offsetting this, leading to net debt of about €8.53b.
How Healthy Is Fraport's Balance Sheet?
We can see from the most recent balance sheet that Fraport had liabilities of €2.04b falling due within a year, and liabilities of €11.7b due beyond that. Offsetting these obligations, it had cash of €2.70b as well as receivables valued at €498.9m due within 12 months. So its liabilities outweigh the sum of its cash and (near-term) receivables by €10.6b.
The deficiency here weighs heavily on the €4.66b company itself, as if a child were struggling under the weight of an enormous back-pack full of books, his sports gear, and a trumpet. So we'd watch its balance sheet closely, without a doubt. After all, Fraport would likely require a major re-capitalisation if it had to pay its creditors today.
We use two main ratios to inform us about debt levels relative to earnings. The first is net debt divided by earnings before interest, tax, depreciation, and amortization (EBITDA), while the second is how many times its earnings before interest and tax (EBIT) covers its interest expense (or its interest cover, for short). The advantage of this approach is that we take into account both the absolute quantum of debt (with net debt to EBITDA) and the actual interest expenses associated with that debt (with its interest cover ratio).
Weak interest cover of 2.4 times and a disturbingly high net debt to EBITDA ratio of 8.8 hit our confidence in Fraport like a one-two punch to the gut. This means we'd consider it to have a heavy debt load. However, it should be some comfort for shareholders to recall that Fraport actually grew its EBIT by a hefty 733%, over the last 12 months. If that earnings trend continues it will make its debt load much more manageable in the future. When analysing debt levels, the balance sheet is the obvious place to start. But it is future earnings, more than anything, that will determine Fraport's ability to maintain a healthy balance sheet going forward. So if you're focused on the future you can check out this free report showing analyst profit forecasts.
Finally, a business needs free cash flow to pay off debt; accounting profits just don't cut it. So we always check how much of that EBIT is translated into free cash flow. Over the last two years, Fraport saw substantial negative free cash flow, in total. While that may be a result of expenditure for growth, it does make the debt far more risky.
Our View
To be frank both Fraport's conversion of EBIT to free cash flow and its track record of staying on top of its total liabilities make us rather uncomfortable with its debt levels. But at least it's pretty decent at growing its EBIT; that's encouraging. It's also worth noting that Fraport is in the Infrastructure industry, which is often considered to be quite defensive. We're quite clear that we consider Fraport to be really rather risky, as a result of its balance sheet health. So we're almost as wary of this stock as a hungry kitten is about falling into its owner's fish pond: once bitten, twice shy, as they say. There's no doubt that we learn most about debt from the balance sheet. However, not all investment risk resides within the balance sheet - far from it. Case in point: We've spotted 2 warning signs for Fraport you should be aware of, and 1 of them doesn't sit too well with us.
At the end of the day, it's often better to focus on companies that are free from net debt. You can access our special list of such companies (all with a track record of profit growth). It's free.
If you're looking to trade Fraport, open an account with the lowest-cost platform trusted by professionals, Interactive Brokers.
With clients in over 200 countries and territories, and access to 160 markets, IBKR lets you trade stocks, options, futures, forex, bonds and funds from a single integrated account.
Enjoy no hidden fees, no account minimums, and FX conversion rates as low as 0.03%, far better than what most brokers offer.
Sponsored ContentNew: AI Stock Screener & Alerts
Our new AI Stock Screener scans the market every day to uncover opportunities.
• Dividend Powerhouses (3%+ Yield)
• Undervalued Small Caps with Insider Buying
• High growth Tech and AI Companies
Or build your own from over 50 metrics.
Have feedback on this article? Concerned about the content? Get in touch with us directly. Alternatively, email editorial-team (at) simplywallst.com.
This article by Simply Wall St is general in nature. We provide commentary based on historical data and analyst forecasts only using an unbiased methodology and our articles are not intended to be financial advice. It does not constitute a recommendation to buy or sell any stock, and does not take account of your objectives, or your financial situation. We aim to bring you long-term focused analysis driven by fundamental data. Note that our analysis may not factor in the latest price-sensitive company announcements or qualitative material. Simply Wall St has no position in any stocks mentioned.
About XTRA:FRA
Fraport
Owns and operates airports in Germany, rest of Europe, Asia, and the United States.
Undervalued with proven track record.

