- Germany
- /
- Wireless Telecom
- /
- XTRA:FNTN
Can freenet AG (ETR:FNTN) Performance Keep Up Given Its Mixed Bag Of Fundamentals?

freenet's (ETR:FNTN) stock up by 3.4% over the past three months. However, the company's financials look a bit inconsistent and market outcomes are ultimately driven by long-term fundamentals, meaning that the stock could head in either direction. In this article, we decided to focus on freenet's ROE.
Return on Equity or ROE is a test of how effectively a company is growing its value and managing investors’ money. In short, ROE shows the profit each dollar generates with respect to its shareholder investments.
See our latest analysis for freenet
How To Calculate Return On Equity?
The formula for ROE is:
Return on Equity = Net Profit (from continuing operations) ÷ Shareholders' Equity
So, based on the above formula, the ROE for freenet is:
19% = €274m ÷ €1.4b (Based on the trailing twelve months to September 2024).
The 'return' is the amount earned after tax over the last twelve months. One way to conceptualize this is that for each €1 of shareholders' capital it has, the company made €0.19 in profit.
What Has ROE Got To Do With Earnings Growth?
So far, we've learned that ROE is a measure of a company's profitability. We now need to evaluate how much profit the company reinvests or "retains" for future growth which then gives us an idea about the growth potential of the company. Assuming everything else remains unchanged, the higher the ROE and profit retention, the higher the growth rate of a company compared to companies that don't necessarily bear these characteristics.
freenet's Earnings Growth And 19% ROE
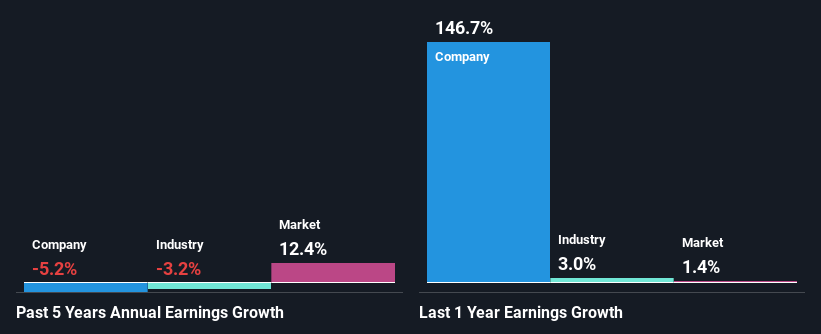
At first glance, freenet seems to have a decent ROE. Especially when compared to the industry average of 5.6% the company's ROE looks pretty impressive. For this reason, freenet's five year net income decline of 5.2% raises the question as to why the high ROE didn't translate into earnings growth. Therefore, there might be some other aspects that could explain this. Such as, the company pays out a huge portion of its earnings as dividends, or is faced with competitive pressures.
Next, when we compared with the industry, which has shrunk its earnings at a rate of 3.2% in the same 5-year period, we still found freenet's performance to be quite bleak, because the company has been shrinking its earnings faster than the industry.
Earnings growth is an important metric to consider when valuing a stock. The investor should try to establish if the expected growth or decline in earnings, whichever the case may be, is priced in. This then helps them determine if the stock is placed for a bright or bleak future. One good indicator of expected earnings growth is the P/E ratio which determines the price the market is willing to pay for a stock based on its earnings prospects. So, you may want to check if freenet is trading on a high P/E or a low P/E, relative to its industry.
Is freenet Efficiently Re-investing Its Profits?
With a three-year median payout ratio as high as 126%,freenet's shrinking earnings don't come as a surprise as the company is paying a dividend which is beyond its means. Its usually very hard to sustain dividend payments that are higher than reported profits.
Moreover, freenet has been paying dividends for at least ten years or more suggesting that management must have perceived that the shareholders prefer dividends over earnings growth. Our latest analyst data shows that the future payout ratio of the company is expected to drop to 75% over the next three years. Regardless, the ROE is not expected to change much for the company despite the lower expected payout ratio.
Conclusion
In total, we're a bit ambivalent about freenet's performance. Despite the high ROE, the company has a disappointing earnings growth number, due to its poor rate of reinvestment into its business. That being so, the latest industry analyst forecasts show that the analysts are expecting to see a huge improvement in the company's earnings growth rate. Are these analysts expectations based on the broad expectations for the industry, or on the company's fundamentals? Click here to be taken to our analyst's forecasts page for the company.
The New Payments ETF Is Live on NASDAQ:
Money is moving to real-time rails, and a newly listed ETF now gives investors direct exposure. Fast settlement. Institutional custody. Simple access.
Explore how this launch could reshape portfolios
Sponsored ContentValuation is complex, but we're here to simplify it.
Discover if freenet might be undervalued or overvalued with our detailed analysis, featuring fair value estimates, potential risks, dividends, insider trades, and its financial condition.
Access Free AnalysisHave feedback on this article? Concerned about the content? Get in touch with us directly. Alternatively, email editorial-team (at) simplywallst.com.
This article by Simply Wall St is general in nature. We provide commentary based on historical data and analyst forecasts only using an unbiased methodology and our articles are not intended to be financial advice. It does not constitute a recommendation to buy or sell any stock, and does not take account of your objectives, or your financial situation. We aim to bring you long-term focused analysis driven by fundamental data. Note that our analysis may not factor in the latest price-sensitive company announcements or qualitative material. Simply Wall St has no position in any stocks mentioned.
About XTRA:FNTN
freenet
Provides telecommunications, broadcasting, and multimedia services for mobile communications/mobile internet, and digital lifestyle sectors in Germany.
Undervalued with excellent balance sheet and pays a dividend.
Similar Companies
Market Insights

Weekly Picks

THE KINGDOM OF BROWN GOODS: WHY MGPI IS BEING CRUSHED BY INVENTORY & PRIMED FOR RESURRECTION


Why Vertical Aerospace (NYSE: EVTL) is Worth Possibly Over 13x its Current Price


The Quiet Giant That Became AI’s Power Grid
Recently Updated Narratives

Jackson Financial Stock: When Insurance Math Meets a Shifting Claims Landscape

Stride Stock: Online Education Finds Its Second Act

CS Disco Stock: Legal AI Is Moving From Efficiency Tool to Competitive Necessity
Popular Narratives


MicroVision will explode future revenue by 380.37% with a vision towards success


Crazy Undervalued 42 Baggers Silver Play (Active & Running Mine)


