The three-year shareholder returns and company earnings persist lower as Cancom (ETR:COK) stock falls a further 5.0% in past week


As an investor its worth striving to ensure your overall portfolio beats the market average. But its virtually certain that sometimes you will buy stocks that fall short of the market average returns. We regret to report that long term Cancom SE (ETR:COK) shareholders have had that experience, with the share price dropping 51% in three years, versus a market decline of about 11%. Unfortunately the share price momentum is still quite negative, with prices down 17% in thirty days. Importantly, this could be a market reaction to the recently released financial results. You can check out the latest numbers in our company report.
Since Cancom has shed €50m from its value in the past 7 days, let's see if the longer term decline has been driven by the business' economics.
See our latest analysis for Cancom
In his essay The Superinvestors of Graham-and-Doddsville Warren Buffett described how share prices do not always rationally reflect the value of a business. By comparing earnings per share (EPS) and share price changes over time, we can get a feel for how investor attitudes to a company have morphed over time.
During the three years that the share price fell, Cancom's earnings per share (EPS) dropped by 1.1% each year. This reduction in EPS is slower than the 21% annual reduction in the share price. So it seems the market was too confident about the business, in the past.
The company's earnings per share (over time) is depicted in the image below (click to see the exact numbers).
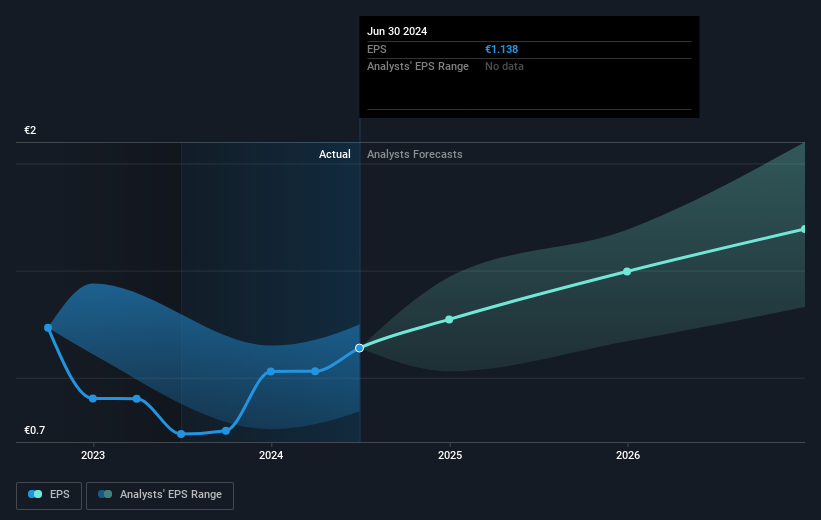
We know that Cancom has improved its bottom line lately, but is it going to grow revenue? You could check out this free report showing analyst revenue forecasts.
What About Dividends?
It is important to consider the total shareholder return, as well as the share price return, for any given stock. Whereas the share price return only reflects the change in the share price, the TSR includes the value of dividends (assuming they were reinvested) and the benefit of any discounted capital raising or spin-off. So for companies that pay a generous dividend, the TSR is often a lot higher than the share price return. In the case of Cancom, it has a TSR of -47% for the last 3 years. That exceeds its share price return that we previously mentioned. The dividends paid by the company have thusly boosted the total shareholder return.
A Different Perspective
Cancom shareholders gained a total return of 6.3% during the year. But that was short of the market average. But at least that's still a gain! Over five years the TSR has been a reduction of 7% per year, over five years. It could well be that the business is stabilizing. Before forming an opinion on Cancom you might want to consider the cold hard cash it pays as a dividend. This free chart tracks its dividend over time.
If you like to buy stocks alongside management, then you might just love this free list of companies. (Hint: many of them are unnoticed AND have attractive valuation).
Please note, the market returns quoted in this article reflect the market weighted average returns of stocks that currently trade on German exchanges.
New: AI Stock Screener & Alerts
Our new AI Stock Screener scans the market every day to uncover opportunities.
• Dividend Powerhouses (3%+ Yield)
• Undervalued Small Caps with Insider Buying
• High growth Tech and AI Companies
Or build your own from over 50 metrics.
Have feedback on this article? Concerned about the content? Get in touch with us directly. Alternatively, email editorial-team (at) simplywallst.com.
This article by Simply Wall St is general in nature. We provide commentary based on historical data and analyst forecasts only using an unbiased methodology and our articles are not intended to be financial advice. It does not constitute a recommendation to buy or sell any stock, and does not take account of your objectives, or your financial situation. We aim to bring you long-term focused analysis driven by fundamental data. Note that our analysis may not factor in the latest price-sensitive company announcements or qualitative material. Simply Wall St has no position in any stocks mentioned.
About XTRA:COK
Cancom
Provides information technology services in Germany and internationally.
Solid track record with excellent balance sheet and pays a dividend.
Similar Companies
Market Insights

Community Narratives
