Münchener Rückversicherungs-Gesellschaft in München (ETR:MUV2) shareholders have earned a 21% CAGR over the last five years


When you buy shares in a company, it's worth keeping in mind the possibility that it could fail, and you could lose your money. But when you pick a company that is really flourishing, you can make more than 100%. Long term Münchener Rückversicherungs-Gesellschaft Aktiengesellschaft in München (ETR:MUV2) shareholders would be well aware of this, since the stock is up 114% in five years. It's also up 16% in about a month.
So let's investigate and see if the longer term performance of the company has been in line with the underlying business' progress.
Check out our latest analysis for Münchener Rückversicherungs-Gesellschaft in München
While markets are a powerful pricing mechanism, share prices reflect investor sentiment, not just underlying business performance. By comparing earnings per share (EPS) and share price changes over time, we can get a feel for how investor attitudes to a company have morphed over time.
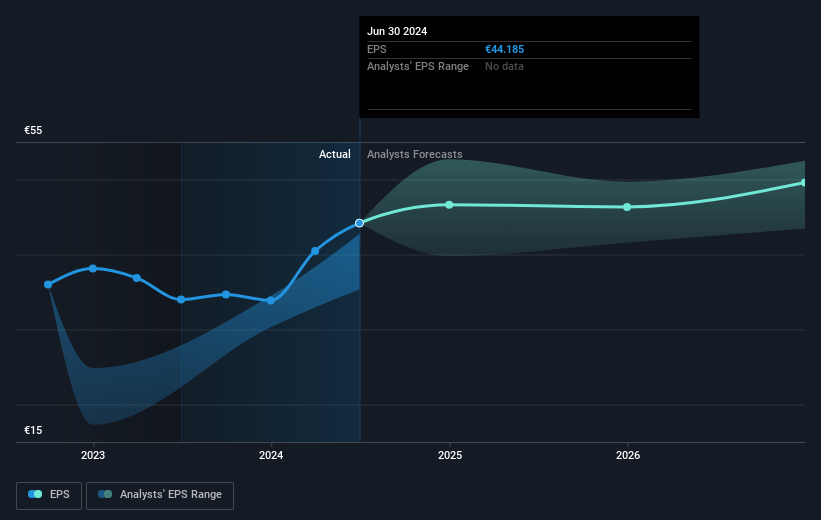
Over half a decade, Münchener Rückversicherungs-Gesellschaft in München managed to grow its earnings per share at 22% a year. The EPS growth is more impressive than the yearly share price gain of 16% over the same period. So it seems the market isn't so enthusiastic about the stock these days. The reasonably low P/E ratio of 11.01 also suggests market apprehension.
You can see below how EPS has changed over time (discover the exact values by clicking on the image).
It is of course excellent to see how Münchener Rückversicherungs-Gesellschaft in München has grown profits over the years, but the future is more important for shareholders. Take a more thorough look at Münchener Rückversicherungs-Gesellschaft in München's financial health with this free report on its balance sheet.
What About Dividends?
When looking at investment returns, it is important to consider the difference between total shareholder return (TSR) and share price return. The TSR is a return calculation that accounts for the value of cash dividends (assuming that any dividend received was reinvested) and the calculated value of any discounted capital raisings and spin-offs. So for companies that pay a generous dividend, the TSR is often a lot higher than the share price return. In the case of Münchener Rückversicherungs-Gesellschaft in München, it has a TSR of 162% for the last 5 years. That exceeds its share price return that we previously mentioned. And there's no prize for guessing that the dividend payments largely explain the divergence!
A Different Perspective
We're pleased to report that Münchener Rückversicherungs-Gesellschaft in München shareholders have received a total shareholder return of 42% over one year. That's including the dividend. Since the one-year TSR is better than the five-year TSR (the latter coming in at 21% per year), it would seem that the stock's performance has improved in recent times. Someone with an optimistic perspective could view the recent improvement in TSR as indicating that the business itself is getting better with time. While it is well worth considering the different impacts that market conditions can have on the share price, there are other factors that are even more important. Take risks, for example - Münchener Rückversicherungs-Gesellschaft in München has 1 warning sign we think you should be aware of.
We will like Münchener Rückversicherungs-Gesellschaft in München better if we see some big insider buys. While we wait, check out this free list of undervalued stocks (mostly small caps) with considerable, recent, insider buying.
Please note, the market returns quoted in this article reflect the market weighted average returns of stocks that currently trade on German exchanges.
New: Manage All Your Stock Portfolios in One Place
We've created the ultimate portfolio companion for stock investors, and it's free.
• Connect an unlimited number of Portfolios and see your total in one currency
• Be alerted to new Warning Signs or Risks via email or mobile
• Track the Fair Value of your stocks
Have feedback on this article? Concerned about the content? Get in touch with us directly. Alternatively, email editorial-team (at) simplywallst.com.
This article by Simply Wall St is general in nature. We provide commentary based on historical data and analyst forecasts only using an unbiased methodology and our articles are not intended to be financial advice. It does not constitute a recommendation to buy or sell any stock, and does not take account of your objectives, or your financial situation. We aim to bring you long-term focused analysis driven by fundamental data. Note that our analysis may not factor in the latest price-sensitive company announcements or qualitative material. Simply Wall St has no position in any stocks mentioned.
About XTRA:MUV2
Münchener Rückversicherungs-Gesellschaft in München
Engages in the insurance and reinsurance businesses worldwide.
Good value with proven track record and pays a dividend.
Similar Companies
Market Insights

Community Narratives
