- Germany
- /
- Consumer Finance
- /
- XTRA:MULT
Would Shareholders Who Purchased Ferratum Oyj's (ETR:FRU) Stock Three Years Be Happy With The Share price Today?

It's not possible to invest over long periods without making some bad investments. But really big losses can really drag down an overall portfolio. So take a moment to sympathize with the long term shareholders of Ferratum Oyj (ETR:FRU), who have seen the share price tank a massive 83% over a three year period. That would certainly shake our confidence in the decision to own the stock. And more recent buyers are having a tough time too, with a drop of 53% in the last year. The falls have accelerated recently, with the share price down 13% in the last three months. We note that the company has reported results fairly recently; and the market is hardly delighted. You can check out the latest numbers in our company report.
We really feel for shareholders in this scenario. It's a good reminder of the importance of diversification, and it's worth keeping in mind there's more to life than money, anyway.
Check out our latest analysis for Ferratum Oyj
While the efficient markets hypothesis continues to be taught by some, it has been proven that markets are over-reactive dynamic systems, and investors are not always rational. One way to examine how market sentiment has changed over time is to look at the interaction between a company's share price and its earnings per share (EPS).
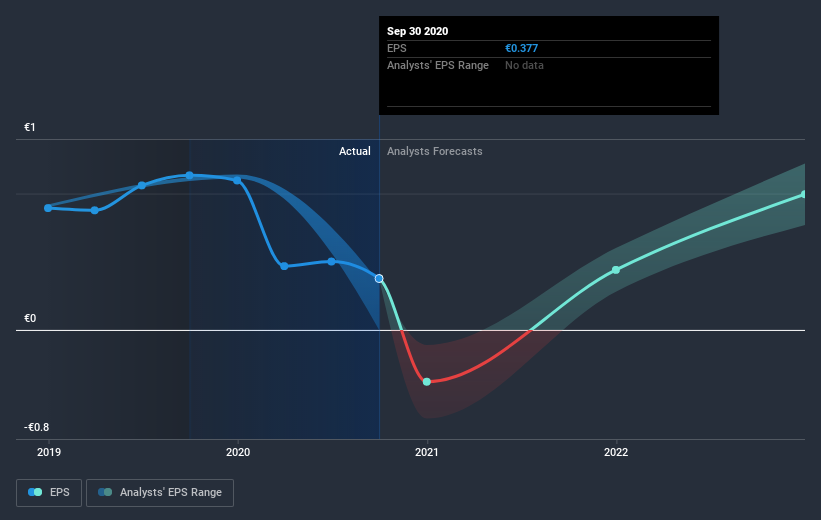
Ferratum Oyj saw its EPS decline at a compound rate of 25% per year, over the last three years. The share price decline of 44% is actually steeper than the EPS slippage. So it's likely that the EPS decline has disappointed the market, leaving investors hesitant to buy.
You can see below how EPS has changed over time (discover the exact values by clicking on the image).

We're pleased to report that the CEO is remunerated more modestly than most CEOs at similarly capitalized companies. But while CEO remuneration is always worth checking, the really important question is whether the company can grow earnings going forward. It might be well worthwhile taking a look at our free report on Ferratum Oyj's earnings, revenue and cash flow.
A Different Perspective
While the broader market gained around 4.2% in the last year, Ferratum Oyj shareholders lost 53%. However, keep in mind that even the best stocks will sometimes underperform the market over a twelve month period. Regrettably, last year's performance caps off a bad run, with the shareholders facing a total loss of 13% per year over five years. Generally speaking long term share price weakness can be a bad sign, though contrarian investors might want to research the stock in hope of a turnaround. It's always interesting to track share price performance over the longer term. But to understand Ferratum Oyj better, we need to consider many other factors. Even so, be aware that Ferratum Oyj is showing 2 warning signs in our investment analysis , you should know about...
If you like to buy stocks alongside management, then you might just love this free list of companies. (Hint: insiders have been buying them).
Please note, the market returns quoted in this article reflect the market weighted average returns of stocks that currently trade on DE exchanges.
If you decide to trade Ferratum Oyj, use the lowest-cost* platform that is rated #1 Overall by Barron’s, Interactive Brokers. Trade stocks, options, futures, forex, bonds and funds on 135 markets, all from a single integrated account. Promoted
New: Manage All Your Stock Portfolios in One Place
We've created the ultimate portfolio companion for stock investors, and it's free.
• Connect an unlimited number of Portfolios and see your total in one currency
• Be alerted to new Warning Signs or Risks via email or mobile
• Track the Fair Value of your stocks
This article by Simply Wall St is general in nature. It does not constitute a recommendation to buy or sell any stock, and does not take account of your objectives, or your financial situation. We aim to bring you long-term focused analysis driven by fundamental data. Note that our analysis may not factor in the latest price-sensitive company announcements or qualitative material. Simply Wall St has no position in any stocks mentioned.
*Interactive Brokers Rated Lowest Cost Broker by StockBrokers.com Annual Online Review 2020
Have feedback on this article? Concerned about the content? Get in touch with us directly. Alternatively, email editorial-team@simplywallst.com.
About XTRA:MULT
Multitude
Provides digital lending and online banking services in Finland.
Undervalued with solid track record.
Market Insights
Community Narratives


