
Advertisement
Some say volatility, rather than debt, is the best way to think about risk as an investor, but Warren Buffett famously said that 'Volatility is far from synonymous with risk.' When we think about how risky a company is, we always like to look at its use of debt, since debt overload can lead to ruin. We can see that TUI AG (ETR:TUI1) does use debt in its business. But the more important question is: how much risk is that debt creating?
What Risk Does Debt Bring?
Generally speaking, debt only becomes a real problem when a company can't easily pay it off, either by raising capital or with its own cash flow. In the worst case scenario, a company can go bankrupt if it cannot pay its creditors. However, a more frequent (but still costly) occurrence is where a company must issue shares at bargain-basement prices, permanently diluting shareholders, just to shore up its balance sheet. Having said that, the most common situation is where a company manages its debt reasonably well - and to its own advantage. The first step when considering a company's debt levels is to consider its cash and debt together.
See our latest analysis for TUI
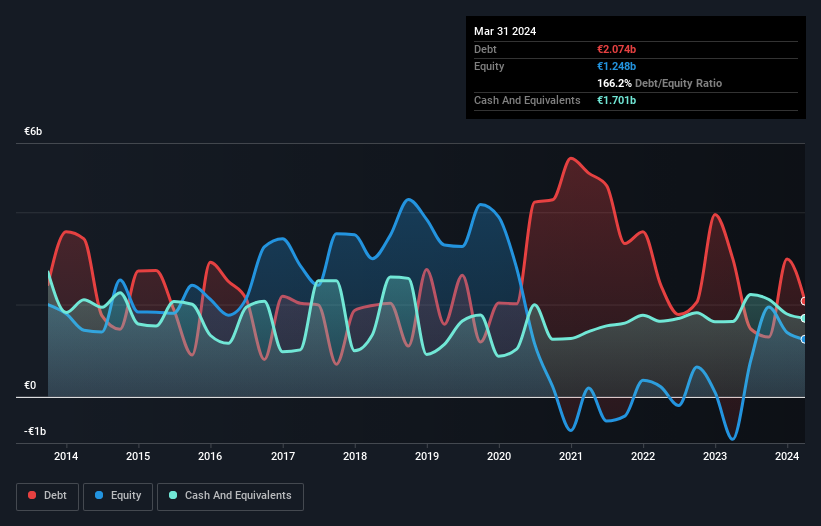
How Much Debt Does TUI Carry?
The image below, which you can click on for greater detail, shows that TUI had debt of €2.07b at the end of March 2024, a reduction from €2.99b over a year. On the flip side, it has €1.70b in cash leading to net debt of about €372.7m.
How Strong Is TUI's Balance Sheet?
According to the last reported balance sheet, TUI had liabilities of €9.28b due within 12 months, and liabilities of €5.70b due beyond 12 months. Offsetting this, it had €1.70b in cash and €1.07b in receivables that were due within 12 months. So its liabilities outweigh the sum of its cash and (near-term) receivables by €12.2b.
This deficit casts a shadow over the €2.81b company, like a colossus towering over mere mortals. So we definitely think shareholders need to watch this one closely. At the end of the day, TUI would probably need a major re-capitalization if its creditors were to demand repayment.
We measure a company's debt load relative to its earnings power by looking at its net debt divided by its earnings before interest, tax, depreciation, and amortization (EBITDA) and by calculating how easily its earnings before interest and tax (EBIT) cover its interest expense (interest cover). Thus we consider debt relative to earnings both with and without depreciation and amortization expenses.
Given net debt is only 0.46 times EBITDA, it is initially surprising to see that TUI's EBIT has low interest coverage of 1.8 times. So one way or the other, it's clear the debt levels are not trivial. Notably, TUI's EBIT launched higher than Elon Musk, gaining a whopping 128% on last year. The balance sheet is clearly the area to focus on when you are analysing debt. But ultimately the future profitability of the business will decide if TUI can strengthen its balance sheet over time. So if you want to see what the professionals think, you might find this free report on analyst profit forecasts to be interesting.
Finally, a business needs free cash flow to pay off debt; accounting profits just don't cut it. So we clearly need to look at whether that EBIT is leading to corresponding free cash flow. Over the last two years, TUI actually produced more free cash flow than EBIT. That sort of strong cash generation warms our hearts like a puppy in a bumblebee suit.
Our View
We feel some trepidation about TUI's difficulty level of total liabilities, but we've got positives to focus on, too. To wit both its conversion of EBIT to free cash flow and EBIT growth rate were encouraging signs. We think that TUI's debt does make it a bit risky, after considering the aforementioned data points together. Not all risk is bad, as it can boost share price returns if it pays off, but this debt risk is worth keeping in mind. Over time, share prices tend to follow earnings per share, so if you're interested in TUI, you may well want to click here to check an interactive graph of its earnings per share history.
When all is said and done, sometimes its easier to focus on companies that don't even need debt. Readers can access a list of growth stocks with zero net debt 100% free, right now.
Valuation is complex, but we're here to simplify it.
Discover if TUI might be undervalued or overvalued with our detailed analysis, featuring fair value estimates, potential risks, dividends, insider trades, and its financial condition.
Access Free AnalysisHave feedback on this article? Concerned about the content? Get in touch with us directly. Alternatively, email editorial-team (at) simplywallst.com.
This article by Simply Wall St is general in nature. We provide commentary based on historical data and analyst forecasts only using an unbiased methodology and our articles are not intended to be financial advice. It does not constitute a recommendation to buy or sell any stock, and does not take account of your objectives, or your financial situation. We aim to bring you long-term focused analysis driven by fundamental data. Note that our analysis may not factor in the latest price-sensitive company announcements or qualitative material. Simply Wall St has no position in any stocks mentioned.
About XTRA:TUI1
Undervalued with proven track record.
Similar Companies
Market Insights

Advertisement
Weekly Picks
RO


RockeTeller on Santacruz Silver Mining ·
Crazy Undervalued 42 Baggers Silver Play (Active & Running Mine)
Fair Value:CA$8696.7% undervalued
50 followersusers have followed this narrative
6 commentsusers have commented on this narrative
16 likesusers have liked this narrative
RO


Robbo on Fiducian Group ·
Fiducian: Compliance Clouds or Value Opportunity?
Fair Value:AU$122.0% undervalued
7 followersusers have followed this narrative
0 commentsusers have commented on this narrative
0 likesusers have liked this narrative
WO

woodworthfund on Willamette Valley Vineyards ·
Willamette Valley Vineyards (WVVI): Not-So-Great Value
Fair Value:US$242.5% overvalued
10 followersusers have followed this narrative
0 commentsusers have commented on this narrative
1 likeusers have liked this narrative
Recently Updated Narratives
MO


mo7md on ADNOC Gas ·
ADNOC Gas future shines with a 21.4% revenue surge
Fair Value:د.إ3.728.9% undervalued
1 followerusers have followed this narrative
0 commentsusers have commented on this narrative
0 likesusers have liked this narrative
IN

IncomeAssets on Pulse Seismic ·
Watch Pulse Seismic Outperform with 13.6% Revenue Growth in the Coming Years
Fair Value:CA$4.4727.3% undervalued
3 followersusers have followed this narrative
0 commentsusers have commented on this narrative
0 likesusers have liked this narrative
VL

Vladislav on Galleon Gold ·
Significantly undervalued gold explorer in Timmins, finally getting traction
Fair Value:CA$481.5% undervalued
7 followersusers have followed this narrative
0 commentsusers have commented on this narrative
0 likesusers have liked this narrative
Popular Narratives
TH


TheWallstreetKing on MicroVision ·
MicroVision will explode future revenue by 380.37% with a vision towards success
Fair Value:US$6098.5% undervalued
116 followersusers have followed this narrative
11 commentsusers have commented on this narrative
22 likesusers have liked this narrative
AN


AnalystConsensusTarget on NVIDIA ·
NVDA: Expanding AI Demand Will Drive Major Data Center Investments Through 2026
Fair Value:US$250.3927.2% undervalued
957 followersusers have followed this narrative
6 commentsusers have commented on this narrative
25 likesusers have liked this narrative
RO
RockeTeller on Santacruz Silver Mining ·
Crazy Undervalued 42 Baggers Silver Play (Active & Running Mine)
Fair Value:CA$8696.7% undervalued
50 followersusers have followed this narrative
6 commentsusers have commented on this narrative
16 likesusers have liked this narrative

