
Advertisement
- Germany
- /
- Hospitality
- /
- XTRA:TUI1
These 4 Measures Indicate That TUI (ETR:TUI1) Is Using Debt Extensively
The external fund manager backed by Berkshire Hathaway's Charlie Munger, Li Lu, makes no bones about it when he says 'The biggest investment risk is not the volatility of prices, but whether you will suffer a permanent loss of capital.' It's only natural to consider a company's balance sheet when you examine how risky it is, since debt is often involved when a business collapses. We can see that TUI AG (ETR:TUI1) does use debt in its business. But should shareholders be worried about its use of debt?
When Is Debt A Problem?
Debt and other liabilities become risky for a business when it cannot easily fulfill those obligations, either with free cash flow or by raising capital at an attractive price. If things get really bad, the lenders can take control of the business. However, a more common (but still painful) scenario is that it has to raise new equity capital at a low price, thus permanently diluting shareholders. Of course, the upside of debt is that it often represents cheap capital, especially when it replaces dilution in a company with the ability to reinvest at high rates of return. When we examine debt levels, we first consider both cash and debt levels, together.
What Is TUI's Net Debt?
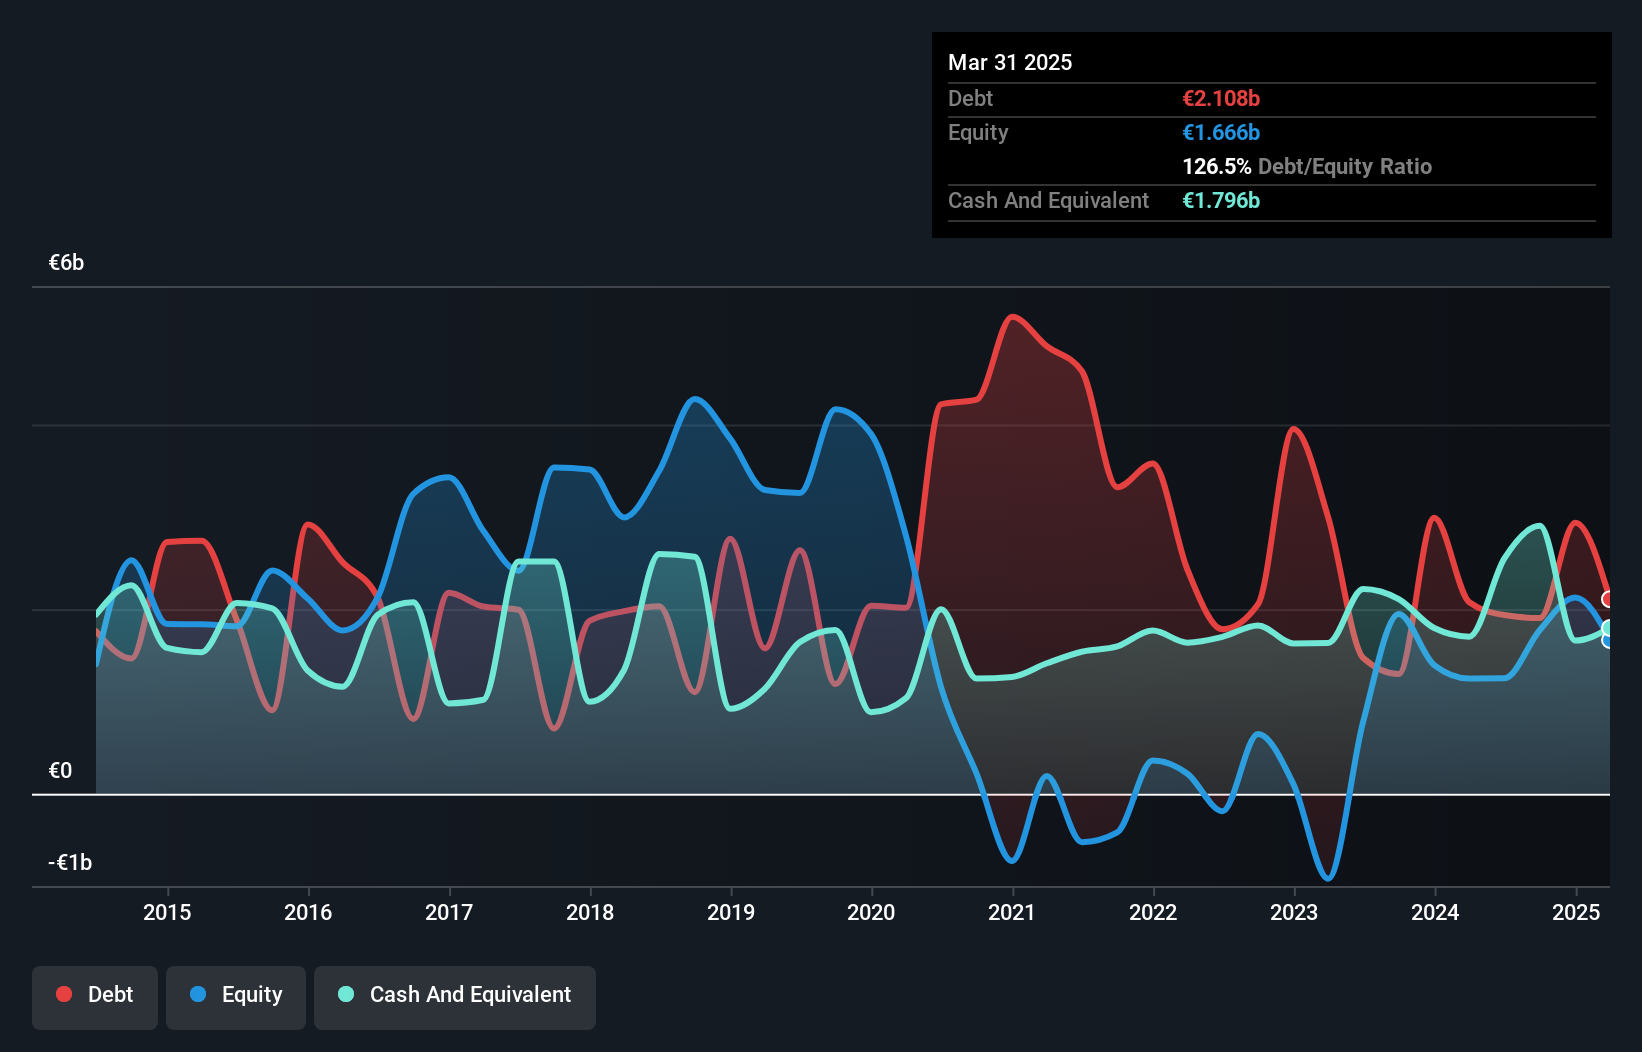
The chart below, which you can click on for greater detail, shows that TUI had €2.11b in debt in March 2025; about the same as the year before. On the flip side, it has €1.80b in cash leading to net debt of about €311.2m.
How Strong Is TUI's Balance Sheet?
Zooming in on the latest balance sheet data, we can see that TUI had liabilities of €10.2b due within 12 months and liabilities of €5.61b due beyond that. Offsetting these obligations, it had cash of €1.80b as well as receivables valued at €1.09b due within 12 months. So it has liabilities totalling €12.9b more than its cash and near-term receivables, combined.
The deficiency here weighs heavily on the €3.35b company itself, as if a child were struggling under the weight of an enormous back-pack full of books, his sports gear, and a trumpet. So we'd watch its balance sheet closely, without a doubt. At the end of the day, TUI would probably need a major re-capitalization if its creditors were to demand repayment.
See our latest analysis for TUI
We use two main ratios to inform us about debt levels relative to earnings. The first is net debt divided by earnings before interest, tax, depreciation, and amortization (EBITDA), while the second is how many times its earnings before interest and tax (EBIT) covers its interest expense (or its interest cover, for short). This way, we consider both the absolute quantum of the debt, as well as the interest rates paid on it.
Given net debt is only 0.32 times EBITDA, it is initially surprising to see that TUI's EBIT has low interest coverage of 2.5 times. So one way or the other, it's clear the debt levels are not trivial. If TUI can keep growing EBIT at last year's rate of 19% over the last year, then it will find its debt load easier to manage. The balance sheet is clearly the area to focus on when you are analysing debt. But ultimately the future profitability of the business will decide if TUI can strengthen its balance sheet over time. So if you want to see what the professionals think, you might find this free report on analyst profit forecasts to be interesting.
But our final consideration is also important, because a company cannot pay debt with paper profits; it needs cold hard cash. So we clearly need to look at whether that EBIT is leading to corresponding free cash flow. Over the last three years, TUI actually produced more free cash flow than EBIT. That sort of strong cash conversion gets us as excited as the crowd when the beat drops at a Daft Punk concert.
Our View
While TUI's level of total liabilities has us nervous. For example, its conversion of EBIT to free cash flow and net debt to EBITDA give us some confidence in its ability to manage its debt. Looking at all the angles mentioned above, it does seem to us that TUI is a somewhat risky investment as a result of its debt. Not all risk is bad, as it can boost share price returns if it pays off, but this debt risk is worth keeping in mind. Above most other metrics, we think its important to track how fast earnings per share is growing, if at all. If you've also come to that realization, you're in luck, because today you can view this interactive graph of TUI's earnings per share history for free.
If you're interested in investing in businesses that can grow profits without the burden of debt, then check out this free list of growing businesses that have net cash on the balance sheet.
Valuation is complex, but we're here to simplify it.
Discover if TUI might be undervalued or overvalued with our detailed analysis, featuring fair value estimates, potential risks, dividends, insider trades, and its financial condition.
Access Free AnalysisHave feedback on this article? Concerned about the content? Get in touch with us directly. Alternatively, email editorial-team (at) simplywallst.com.
This article by Simply Wall St is general in nature. We provide commentary based on historical data and analyst forecasts only using an unbiased methodology and our articles are not intended to be financial advice. It does not constitute a recommendation to buy or sell any stock, and does not take account of your objectives, or your financial situation. We aim to bring you long-term focused analysis driven by fundamental data. Note that our analysis may not factor in the latest price-sensitive company announcements or qualitative material. Simply Wall St has no position in any stocks mentioned.
About XTRA:TUI1
Undervalued with proven track record.
Similar Companies
Market Insights

Advertisement
Community Narratives
MicroVision will explode future revenue by 380.37% with a vision towards success
Fair Value US$60|98.4% undervalued
TH
Community Contributor
The Indispensable Artery for a New North American Economy
Fair Value CA$132.87|0.8% undervalued
TI
Community Contributor
Recently Updated Narratives
CO

composite32 on TAV Havalimanlari Holding ·
TAV Havalimanlari Holding will fly high with 25.68% revenue growth
Fair Value:₺545.1648.6% undervalued
3 followersusers have followed this narrative
0 commentsusers have commented on this narrative
0 likesusers have liked this narrative
RO


Robbo on Fiducian Group ·
Fiducian: Compliance Clouds or Value Opportunity?
Fair Value:AU$120.8% undervalued
1 followerusers have followed this narrative
0 commentsusers have commented on this narrative
0 likesusers have liked this narrative
MA


MarkoVT on COVER ·
Q3 Outlook modestly optimistic
Fair Value:JP¥1.65k1.3% overvalued
1 followerusers have followed this narrative
0 commentsusers have commented on this narrative
0 likesusers have liked this narrative
Popular Narratives
TH

TheWallstreetKing on MicroVision ·
MicroVision will explode future revenue by 380.37% with a vision towards success
Fair Value:US$6098.4% undervalued
93 followersusers have followed this narrative
10 commentsusers have commented on this narrative
18 likesusers have liked this narrative
OS


oscargarcia on Alphabet ·
The company that turned a verb into a global necessity and basically runs the modern internet, digital ads, smartphones, maps, and AI.
Fair Value:US$3405.9% undervalued
136 followersusers have followed this narrative
6 commentsusers have commented on this narrative
18 likesusers have liked this narrative
AN


AnalystConsensusTarget on NVIDIA ·
NVDA: Expanding AI Demand Will Drive Major Data Center Investments Through 2026
Fair Value:US$232.7922.6% undervalued
929 followersusers have followed this narrative
6 commentsusers have commented on this narrative
22 likesusers have liked this narrative