
Advertisement
Warren Buffett famously said, 'Volatility is far from synonymous with risk.' So it might be obvious that you need to consider debt, when you think about how risky any given stock is, because too much debt can sink a company. We note that adidas AG (ETR:ADS) does have debt on its balance sheet. But is this debt a concern to shareholders?
We check all companies for important risks. See what we found for adidas in our free report.When Is Debt Dangerous?
Debt and other liabilities become risky for a business when it cannot easily fulfill those obligations, either with free cash flow or by raising capital at an attractive price. If things get really bad, the lenders can take control of the business. While that is not too common, we often do see indebted companies permanently diluting shareholders because lenders force them to raise capital at a distressed price. Of course, the upside of debt is that it often represents cheap capital, especially when it replaces dilution in a company with the ability to reinvest at high rates of return. When we think about a company's use of debt, we first look at cash and debt together.
What Is adidas's Net Debt?
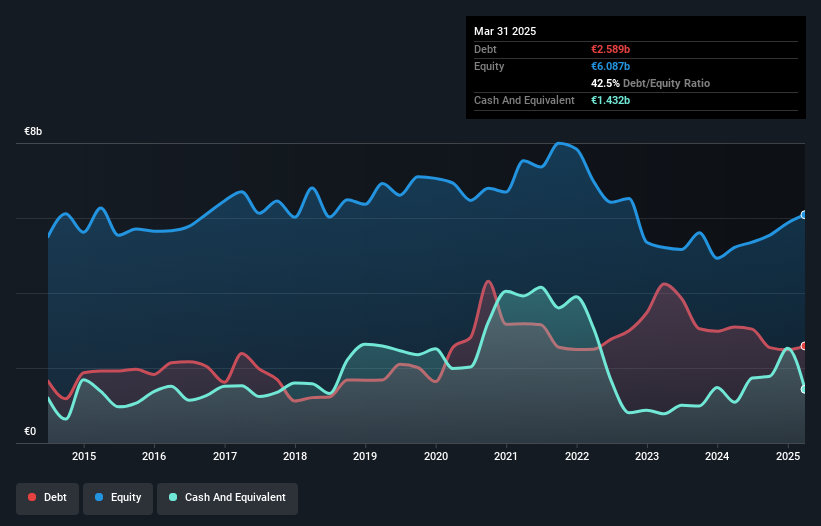
The image below, which you can click on for greater detail, shows that adidas had debt of €2.59b at the end of March 2025, a reduction from €3.10b over a year. However, it does have €1.43b in cash offsetting this, leading to net debt of about €1.16b.
How Healthy Is adidas' Balance Sheet?
According to the last reported balance sheet, adidas had liabilities of €8.94b due within 12 months, and liabilities of €5.06b due beyond 12 months. On the other hand, it had cash of €1.43b and €3.24b worth of receivables due within a year. So its liabilities outweigh the sum of its cash and (near-term) receivables by €9.33b.
adidas has a very large market capitalization of €39.1b, so it could very likely raise cash to ameliorate its balance sheet, if the need arose. But we definitely want to keep our eyes open to indications that its debt is bringing too much risk.
Check out our latest analysis for adidas
We use two main ratios to inform us about debt levels relative to earnings. The first is net debt divided by earnings before interest, tax, depreciation, and amortization (EBITDA), while the second is how many times its earnings before interest and tax (EBIT) covers its interest expense (or its interest cover, for short). The advantage of this approach is that we take into account both the absolute quantum of debt (with net debt to EBITDA) and the actual interest expenses associated with that debt (with its interest cover ratio).
adidas has a low net debt to EBITDA ratio of only 0.54. And its EBIT easily covers its interest expense, being 16.3 times the size. So you could argue it is no more threatened by its debt than an elephant is by a mouse. Even more impressive was the fact that adidas grew its EBIT by 187% over twelve months. If maintained that growth will make the debt even more manageable in the years ahead. The balance sheet is clearly the area to focus on when you are analysing debt. But it is future earnings, more than anything, that will determine adidas's ability to maintain a healthy balance sheet going forward. So if you're focused on the future you can check out this free report showing analyst profit forecasts.
Finally, a business needs free cash flow to pay off debt; accounting profits just don't cut it. So we always check how much of that EBIT is translated into free cash flow. Over the last three years, adidas actually produced more free cash flow than EBIT. There's nothing better than incoming cash when it comes to staying in your lenders' good graces.
Our View
adidas's interest cover suggests it can handle its debt as easily as Cristiano Ronaldo could score a goal against an under 14's goalkeeper. And the good news does not stop there, as its conversion of EBIT to free cash flow also supports that impression! Considering this range of factors, it seems to us that adidas is quite prudent with its debt, and the risks seem well managed. So we're not worried about the use of a little leverage on the balance sheet. Above most other metrics, we think its important to track how fast earnings per share is growing, if at all. If you've also come to that realization, you're in luck, because today you can view this interactive graph of adidas's earnings per share history for free.
If, after all that, you're more interested in a fast growing company with a rock-solid balance sheet, then check out our list of net cash growth stocks without delay.
New: AI Stock Screener & Alerts
Our new AI Stock Screener scans the market every day to uncover opportunities.
• Dividend Powerhouses (3%+ Yield)
• Undervalued Small Caps with Insider Buying
• High growth Tech and AI Companies
Or build your own from over 50 metrics.
Have feedback on this article? Concerned about the content? Get in touch with us directly. Alternatively, email editorial-team (at) simplywallst.com.
This article by Simply Wall St is general in nature. We provide commentary based on historical data and analyst forecasts only using an unbiased methodology and our articles are not intended to be financial advice. It does not constitute a recommendation to buy or sell any stock, and does not take account of your objectives, or your financial situation. We aim to bring you long-term focused analysis driven by fundamental data. Note that our analysis may not factor in the latest price-sensitive company announcements or qualitative material. Simply Wall St has no position in any stocks mentioned.
About XTRA:ADS
adidas
Designs, develops, produces, and markets athletic and sports lifestyle products in Europe, North America, Greater China, Latin America, Japan, and South Korea.
High growth potential with solid track record.
Similar Companies
Market Insights

Advertisement
Community Narratives
America Wants Homegrown Drones — Draganfly Is Ready to Deliver
Fair Value US$9.21|28.9% undervalued
JO
Community Contributor
Cheesecake Factory offers an enticing opportunity for long-term growth by leveraging new concepts
Fair Value US$73.83|27.0% undervalued
ZW
Community Contributor
Coca-Cola’s Intrinsic Value Set to Rise with Fed Rate Cut
Fair Value US$67.50|1.9% undervalued
AL
Community Contributor
Fully Permitted Gold Mine with 50 Baggers Potential 
Fair Value CA$41.00|98.5% undervalued
RO
Community Contributor