- Germany
- /
- Commercial Services
- /
- DB:TUR
Investors Still Aren't Entirely Convinced By Turbon AG's (FRA:TUR) Revenues Despite 27% Price Jump


Turbon AG (FRA:TUR) shareholders would be excited to see that the share price has had a great month, posting a 27% gain and recovering from prior weakness. But the gains over the last month weren't enough to make shareholders whole, as the share price is still down 7.5% in the last twelve months.
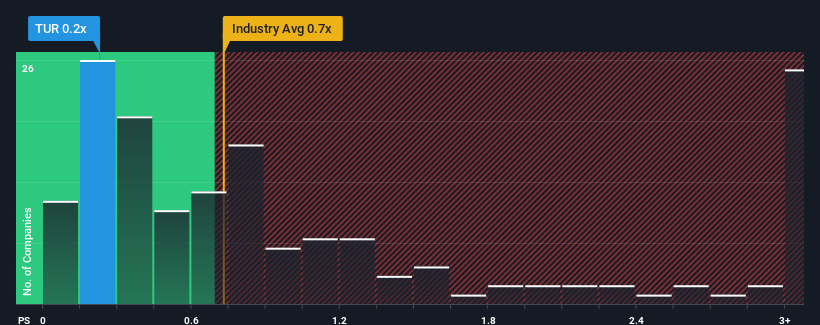
Although its price has surged higher, it's still not a stretch to say that Turbon's price-to-sales (or "P/S") ratio of 0.2x right now seems quite "middle-of-the-road" compared to the Commercial Services industry in Germany, where the median P/S ratio is around 0.6x. While this might not raise any eyebrows, if the P/S ratio is not justified investors could be missing out on a potential opportunity or ignoring looming disappointment.
View our latest analysis for Turbon
How Has Turbon Performed Recently?
The recent revenue growth at Turbon would have to be considered satisfactory if not spectacular. One possibility is that the P/S is moderate because investors think this good revenue growth might only be parallel to the broader industry in the near future. Those who are bullish on Turbon will be hoping that this isn't the case, so that they can pick up the stock at a lower valuation.
Want the full picture on earnings, revenue and cash flow for the company? Then our free report on Turbon will help you shine a light on its historical performance.What Are Revenue Growth Metrics Telling Us About The P/S?
Turbon's P/S ratio would be typical for a company that's only expected to deliver moderate growth, and importantly, perform in line with the industry.
If we review the last year of revenue growth, the company posted a worthy increase of 3.9%. This was backed up an excellent period prior to see revenue up by 37% in total over the last three years. Accordingly, shareholders would have definitely welcomed those medium-term rates of revenue growth.
Comparing that recent medium-term revenue trajectory with the industry's one-year growth forecast of 6.9% shows it's noticeably more attractive.
With this information, we find it interesting that Turbon is trading at a fairly similar P/S compared to the industry. Apparently some shareholders believe the recent performance is at its limits and have been accepting lower selling prices.
What Does Turbon's P/S Mean For Investors?
Its shares have lifted substantially and now Turbon's P/S is back within range of the industry median. While the price-to-sales ratio shouldn't be the defining factor in whether you buy a stock or not, it's quite a capable barometer of revenue expectations.
We didn't quite envision Turbon's P/S sitting in line with the wider industry, considering the revenue growth over the last three-year is higher than the current industry outlook. When we see strong revenue with faster-than-industry growth, we can only assume potential risks are what might be placing pressure on the P/S ratio. At least the risk of a price drop looks to be subdued if recent medium-term revenue trends continue, but investors seem to think future revenue could see some volatility.
We don't want to rain on the parade too much, but we did also find 3 warning signs for Turbon that you need to be mindful of.
It's important to make sure you look for a great company, not just the first idea you come across. So if growing profitability aligns with your idea of a great company, take a peek at this free list of interesting companies with strong recent earnings growth (and a low P/E).
Valuation is complex, but we're here to simplify it.
Discover if Turbon might be undervalued or overvalued with our detailed analysis, featuring fair value estimates, potential risks, dividends, insider trades, and its financial condition.
Access Free AnalysisHave feedback on this article? Concerned about the content? Get in touch with us directly. Alternatively, email editorial-team (at) simplywallst.com.
This article by Simply Wall St is general in nature. We provide commentary based on historical data and analyst forecasts only using an unbiased methodology and our articles are not intended to be financial advice. It does not constitute a recommendation to buy or sell any stock, and does not take account of your objectives, or your financial situation. We aim to bring you long-term focused analysis driven by fundamental data. Note that our analysis may not factor in the latest price-sensitive company announcements or qualitative material. Simply Wall St has no position in any stocks mentioned.
About DB:TUR
Turbon
Engages in the development, production, and sale of typeface printing accessories in Europe, the United States, and Asia.
Flawless balance sheet second-rate dividend payer.
