- Germany
- /
- Electrical
- /
- XTRA:F3C
Analyst Estimates: Here's What Brokers Think Of SFC Energy AG (ETR:F3C) After Its Second-Quarter Report

It's been a good week for SFC Energy AG (ETR:F3C) shareholders, because the company has just released its latest second-quarter results, and the shares gained 5.7% to €15.60. Overall the results were a little better than the analysts were expecting, with revenues beating forecasts by 8.3%to hit €12m. Earnings are an important time for investors, as they can track a company's performance, look at what the analysts are forecasting for next year, and see if there's been a change in sentiment towards the company. We've gathered the most recent statutory forecasts to see whether the analysts have changed their earnings models, following these results.
Check out our latest analysis for SFC Energy

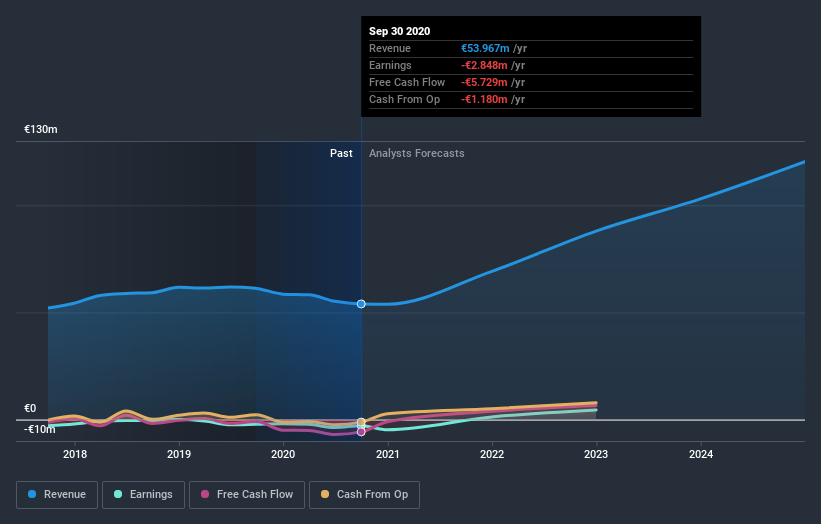
Taking into account the latest results, SFC Energy's four analysts currently expect revenues in 2020 to be €53.8m, approximately in line with the last 12 months. Per-share losses are expected to explode, reaching €0.36 per share. Before this earnings announcement, the analysts had been modelling revenues of €54.0m and losses of €0.43 per share in 2020. Although the revenue estimates have not really changed SFC Energy'sfuture looks a little different to the past, with a the loss per share forecasts in particular.
There's been no major changes to the consensus price target of €13.95, suggesting that reduced loss estimates are not enough to have a long-term positive impact on the stock's valuation. That's not the only conclusion we can draw from this data however, as some investors also like to consider the spread in estimates when evaluating analyst price targets. The most optimistic SFC Energy analyst has a price target of €18.00 per share, while the most pessimistic values it at €6.50. This is a fairly broad spread of estimates, suggesting that analysts are forecasting a wide range of possible outcomes for the business.
One way to get more context on these forecasts is to look at how they compare to both past performance, and how other companies in the same industry are performing. We would highlight that sales are expected to reverse, with the forecast 0.2% revenue decline a notable change from historical growth of 5.9% over the last five years. By contrast, our data suggests that other companies (with analyst coverage) in the same industry are forecast to see their revenue grow 8.4% annually for the foreseeable future. So although its revenues are forecast to shrink, this cloud does not come with a silver lining - SFC Energy is expected to lag the wider industry.
The Bottom Line
The most important thing to take away is that the analysts reconfirmed their loss per share estimates for next year. On the plus side, there were no major changes to revenue estimates; although forecasts imply revenues will perform worse than the wider industry. There was no real change to the consensus price target, suggesting that the intrinsic value of the business has not undergone any major changes with the latest estimates.
Keeping that in mind, we still think that the longer term trajectory of the business is much more important for investors to consider. We have estimates - from multiple SFC Energy analysts - going out to 2024, and you can see them free on our platform here.
Another thing to consider is whether management and directors have been buying or selling stock recently. We provide an overview of all open market stock trades for the last twelve months on our platform, here.
If you’re looking to trade SFC Energy, open an account with the lowest-cost* platform trusted by professionals, Interactive Brokers. Their clients from over 200 countries and territories trade stocks, options, futures, forex, bonds and funds worldwide from a single integrated account. Promoted
If you're looking to trade SFC Energy, open an account with the lowest-cost platform trusted by professionals, Interactive Brokers.
With clients in over 200 countries and territories, and access to 160 markets, IBKR lets you trade stocks, options, futures, forex, bonds and funds from a single integrated account.
Enjoy no hidden fees, no account minimums, and FX conversion rates as low as 0.03%, far better than what most brokers offer.
Sponsored ContentNew: Manage All Your Stock Portfolios in One Place
We've created the ultimate portfolio companion for stock investors, and it's free.
• Connect an unlimited number of Portfolios and see your total in one currency
• Be alerted to new Warning Signs or Risks via email or mobile
• Track the Fair Value of your stocks
This article by Simply Wall St is general in nature. It does not constitute a recommendation to buy or sell any stock, and does not take account of your objectives, or your financial situation. We aim to bring you long-term focused analysis driven by fundamental data. Note that our analysis may not factor in the latest price-sensitive company announcements or qualitative material. Simply Wall St has no position in any stocks mentioned.
*Interactive Brokers Rated Lowest Cost Broker by StockBrokers.com Annual Online Review 2020
Have feedback on this article? Concerned about the content? Get in touch with us directly. Alternatively, email editorial-team@simplywallst.com.
About XTRA:F3C
SFC Energy
Develops, produces, and distributes systems and solutions for stationary and mobile off-grid power supply based on hydrogen and direct methanol fuel cells worldwide.
Flawless balance sheet with reasonable growth potential.
Similar Companies
Market Insights
Community Narratives


