
Advertisement
- Germany
- /
- Industrials
- /
- XTRA:BYW
BayWa (ETR:BYW) delivers shareholders decent 9.8% CAGR over 5 years, surging 3.8% in the last week alone
While BayWa Aktiengesellschaft (ETR:BYW) shareholders are probably generally happy, the stock hasn't had particularly good run recently, with the share price falling 19% in the last quarter. On the bright side the returns have been quite good over the last half decade. Its return of 42% has certainly bested the market return! Unfortunately not all shareholders will have held it for the long term, so spare a thought for those caught in the 29% decline over the last twelve months.
Since the stock has added €54m to its market cap in the past week alone, let's see if underlying performance has been driving long-term returns.
See our latest analysis for BayWa
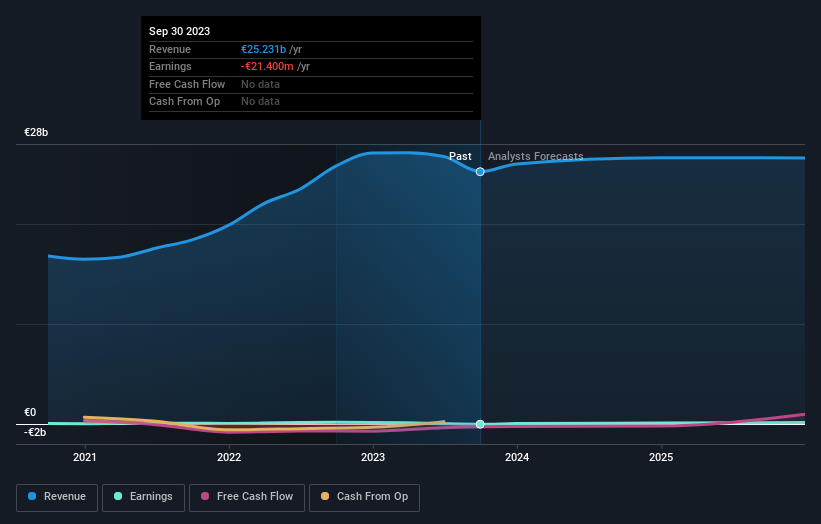
Given that BayWa didn't make a profit in the last twelve months, we'll focus on revenue growth to form a quick view of its business development. Generally speaking, companies without profits are expected to grow revenue every year, and at a good clip. As you can imagine, fast revenue growth, when maintained, often leads to fast profit growth.
For the last half decade, BayWa can boast revenue growth at a rate of 12% per year. That's a fairly respectable growth rate. While the share price has beat the market, compounding at 7% yearly, over five years, there's certainly some potential that the market hasn't fully considered the growth track record. The key question is whether revenue growth will slow down, and if so, how quickly. There's no doubt that it can be difficult to value pre-profit companies.
The image below shows how earnings and revenue have tracked over time (if you click on the image you can see greater detail).
If you are thinking of buying or selling BayWa stock, you should check out this FREE detailed report on its balance sheet.
What About Dividends?
As well as measuring the share price return, investors should also consider the total shareholder return (TSR). Whereas the share price return only reflects the change in the share price, the TSR includes the value of dividends (assuming they were reinvested) and the benefit of any discounted capital raising or spin-off. So for companies that pay a generous dividend, the TSR is often a lot higher than the share price return. We note that for BayWa the TSR over the last 5 years was 59%, which is better than the share price return mentioned above. This is largely a result of its dividend payments!
A Different Perspective
While the broader market gained around 14% in the last year, BayWa shareholders lost 27% (even including dividends). However, keep in mind that even the best stocks will sometimes underperform the market over a twelve month period. On the bright side, long term shareholders have made money, with a gain of 10% per year over half a decade. It could be that the recent sell-off is an opportunity, so it may be worth checking the fundamental data for signs of a long term growth trend. While it is well worth considering the different impacts that market conditions can have on the share price, there are other factors that are even more important. Case in point: We've spotted 2 warning signs for BayWa you should be aware of.
For those who like to find winning investments this free list of growing companies with recent insider purchasing, could be just the ticket.
Please note, the market returns quoted in this article reflect the market weighted average returns of stocks that currently trade on German exchanges.
Valuation is complex, but we're here to simplify it.
Discover if BayWa might be undervalued or overvalued with our detailed analysis, featuring fair value estimates, potential risks, dividends, insider trades, and its financial condition.
Access Free AnalysisHave feedback on this article? Concerned about the content? Get in touch with us directly. Alternatively, email editorial-team (at) simplywallst.com.
This article by Simply Wall St is general in nature. We provide commentary based on historical data and analyst forecasts only using an unbiased methodology and our articles are not intended to be financial advice. It does not constitute a recommendation to buy or sell any stock, and does not take account of your objectives, or your financial situation. We aim to bring you long-term focused analysis driven by fundamental data. Note that our analysis may not factor in the latest price-sensitive company announcements or qualitative material. Simply Wall St has no position in any stocks mentioned.
About XTRA:BYW
BayWa
Provides wholesale, retail, logistics, and support and consultancy services in Germany and internationally.
Slight risk and fair value.
Similar Companies
Market Insights

Advertisement
Community Narratives
Quality at a Premium. A time to watch, not to buy?
Fair Value US$154.56|29.3% undervalued
DA
Community Contributor
GRAB: The Super-App at the Heart of Southeast Asia’s Digital Boom
Fair Value US$6.60|7.0% undervalued
BL
Community Contributor
Verve Group to Surge with 51.61% Revenue Growth
Fair Value €6.00|65.0% undervalued
ME
Community Contributor