- Czech Republic
- /
- Electric Utilities
- /
- SEP:CEZ
CEZ, a. s.'s (SEP:CEZ) Intrinsic Value Is Potentially 48% Above Its Share Price


Key Insights
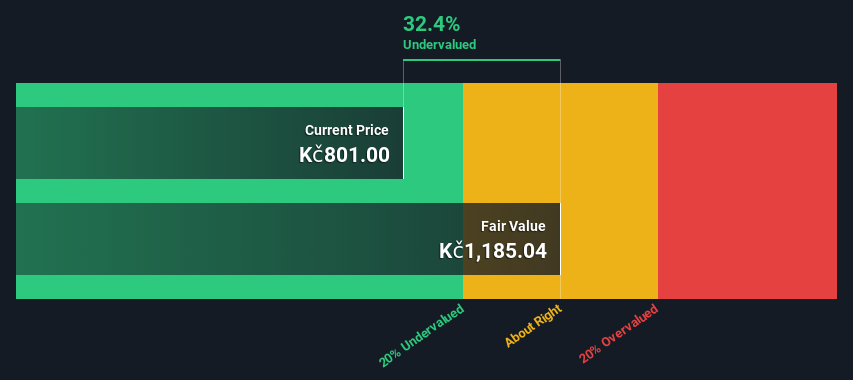
- CEZ a. s' estimated fair value is Kč1,185 based on 2 Stage Free Cash Flow to Equity
- CEZ a. s' Kč801 share price signals that it might be 32% undervalued
- Analyst price target for CEZ is Kč869 which is 27% below our fair value estimate
In this article we are going to estimate the intrinsic value of CEZ, a. s. (SEP:CEZ) by taking the expected future cash flows and discounting them to today's value. We will take advantage of the Discounted Cash Flow (DCF) model for this purpose. There's really not all that much to it, even though it might appear quite complex.
We would caution that there are many ways of valuing a company and, like the DCF, each technique has advantages and disadvantages in certain scenarios. Anyone interested in learning a bit more about intrinsic value should have a read of the Simply Wall St analysis model.
See our latest analysis for CEZ a. s
Crunching The Numbers
We use what is known as a 2-stage model, which simply means we have two different periods of growth rates for the company's cash flows. Generally the first stage is higher growth, and the second stage is a lower growth phase. To begin with, we have to get estimates of the next ten years of cash flows. Where possible we use analyst estimates, but when these aren't available we extrapolate the previous free cash flow (FCF) from the last estimate or reported value. We assume companies with shrinking free cash flow will slow their rate of shrinkage, and that companies with growing free cash flow will see their growth rate slow, over this period. We do this to reflect that growth tends to slow more in the early years than it does in later years.
A DCF is all about the idea that a dollar in the future is less valuable than a dollar today, so we discount the value of these future cash flows to their estimated value in today's dollars:
10-year free cash flow (FCF) estimate
| 2024 | 2025 | 2026 | 2027 | 2028 | 2029 | 2030 | 2031 | 2032 | 2033 | |
| Levered FCF (CZK, Millions) | Kč39.4b | Kč44.6b | Kč54.9b | Kč41.9b | Kč34.8b | Kč32.7b | Kč31.7b | Kč31.2b | Kč31.1b | Kč31.3b |
| Growth Rate Estimate Source | Analyst x4 | Analyst x4 | Analyst x4 | Analyst x3 | Analyst x2 | Est @ -5.93% | Est @ -3.32% | Est @ -1.49% | Est @ -0.21% | Est @ 0.68% |
| Present Value (CZK, Millions) Discounted @ 7.2% | Kč36.8k | Kč38.9k | Kč44.6k | Kč31.8k | Kč24.6k | Kč21.6k | Kč19.5k | Kč17.9k | Kč16.7k | Kč15.7k |
("Est" = FCF growth rate estimated by Simply Wall St)
Present Value of 10-year Cash Flow (PVCF) = Kč268b
We now need to calculate the Terminal Value, which accounts for all the future cash flows after this ten year period. The Gordon Growth formula is used to calculate Terminal Value at a future annual growth rate equal to the 5-year average of the 10-year government bond yield of 2.8%. We discount the terminal cash flows to today's value at a cost of equity of 7.2%.
Terminal Value (TV)= FCF2033 × (1 + g) ÷ (r – g) = Kč31b× (1 + 2.8%) ÷ (7.2%– 2.8%) = Kč734b
Present Value of Terminal Value (PVTV)= TV / (1 + r)10= Kč734b÷ ( 1 + 7.2%)10= Kč368b
The total value is the sum of cash flows for the next ten years plus the discounted terminal value, which results in the Total Equity Value, which in this case is Kč636b. To get the intrinsic value per share, we divide this by the total number of shares outstanding. Relative to the current share price of Kč801, the company appears quite undervalued at a 32% discount to where the stock price trades currently. Remember though, that this is just an approximate valuation, and like any complex formula - garbage in, garbage out.
The Assumptions
We would point out that the most important inputs to a discounted cash flow are the discount rate and of course the actual cash flows. You don't have to agree with these inputs, I recommend redoing the calculations yourself and playing with them. The DCF also does not consider the possible cyclicality of an industry, or a company's future capital requirements, so it does not give a full picture of a company's potential performance. Given that we are looking at CEZ a. s as potential shareholders, the cost of equity is used as the discount rate, rather than the cost of capital (or weighted average cost of capital, WACC) which accounts for debt. In this calculation we've used 7.2%, which is based on a levered beta of 0.800. Beta is a measure of a stock's volatility, compared to the market as a whole. We get our beta from the industry average beta of globally comparable companies, with an imposed limit between 0.8 and 2.0, which is a reasonable range for a stable business.
SWOT Analysis for CEZ a. s
- Debt is well covered by earnings and cashflows.
- Dividend is in the top 25% of dividend payers in the market.
- Earnings growth over the past year underperformed the Electric Utilities industry.
- Trading below our estimate of fair value by more than 20%.
- Dividends are not covered by earnings.
- Annual earnings are forecast to decline for the next 4 years.
Next Steps:
Valuation is only one side of the coin in terms of building your investment thesis, and it ideally won't be the sole piece of analysis you scrutinize for a company. The DCF model is not a perfect stock valuation tool. Preferably you'd apply different cases and assumptions and see how they would impact the company's valuation. For instance, if the terminal value growth rate is adjusted slightly, it can dramatically alter the overall result. Why is the intrinsic value higher than the current share price? For CEZ a. s, we've compiled three essential elements you should further examine:
- Risks: Consider for instance, the ever-present spectre of investment risk. We've identified 3 warning signs with CEZ a. s (at least 1 which is potentially serious) , and understanding these should be part of your investment process.
- Future Earnings: How does CEZ's growth rate compare to its peers and the wider market? Dig deeper into the analyst consensus number for the upcoming years by interacting with our free analyst growth expectation chart.
- Other Solid Businesses: Low debt, high returns on equity and good past performance are fundamental to a strong business. Why not explore our interactive list of stocks with solid business fundamentals to see if there are other companies you may not have considered!
PS. Simply Wall St updates its DCF calculation for every Czech stock every day, so if you want to find the intrinsic value of any other stock just search here.
New: AI Stock Screener & Alerts
Our new AI Stock Screener scans the market every day to uncover opportunities.
• Dividend Powerhouses (3%+ Yield)
• Undervalued Small Caps with Insider Buying
• High growth Tech and AI Companies
Or build your own from over 50 metrics.
Have feedback on this article? Concerned about the content? Get in touch with us directly. Alternatively, email editorial-team (at) simplywallst.com.
This article by Simply Wall St is general in nature. We provide commentary based on historical data and analyst forecasts only using an unbiased methodology and our articles are not intended to be financial advice. It does not constitute a recommendation to buy or sell any stock, and does not take account of your objectives, or your financial situation. We aim to bring you long-term focused analysis driven by fundamental data. Note that our analysis may not factor in the latest price-sensitive company announcements or qualitative material. Simply Wall St has no position in any stocks mentioned.
About SEP:CEZ
CEZ a. s
Engages in the generation, distribution, trade, and sale of electricity and heat in Western, Central, and Southeastern Europe.
Mediocre balance sheet second-rate dividend payer.
Similar Companies
Market Insights

Community Narratives

