
Advertisement
- China
- /
- Electric Utilities
- /
- SZSE:001896
Further Upside For Henan Yuneng Holdings Co.,Ltd. (SZSE:001896) Shares Could Introduce Price Risks After 35% Bounce
Henan Yuneng Holdings Co.,Ltd. (SZSE:001896) shareholders would be excited to see that the share price has had a great month, posting a 35% gain and recovering from prior weakness. Notwithstanding the latest gain, the annual share price return of 3.9% isn't as impressive.
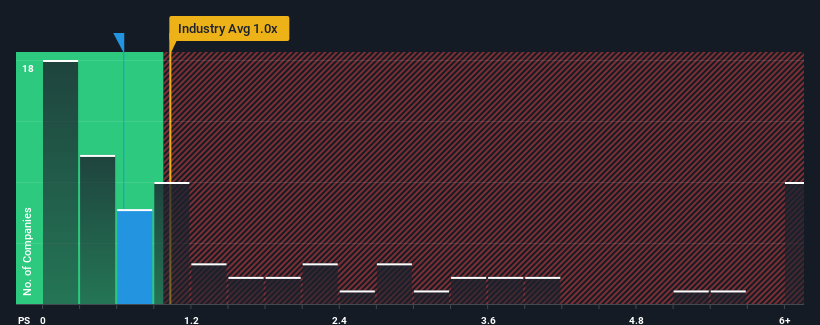
In spite of the firm bounce in price, Henan Yuneng HoldingsLtd's price-to-sales (or "P/S") ratio of 0.6x might still make it look like a buy right now compared to the Electric Utilities industry in China, where around half of the companies have P/S ratios above 1.2x and even P/S above 4x are quite common. Nonetheless, we'd need to dig a little deeper to determine if there is a rational basis for the reduced P/S.
View our latest analysis for Henan Yuneng HoldingsLtd
What Does Henan Yuneng HoldingsLtd's P/S Mean For Shareholders?
As an illustration, revenue has deteriorated at Henan Yuneng HoldingsLtd over the last year, which is not ideal at all. It might be that many expect the disappointing revenue performance to continue or accelerate, which has repressed the P/S. If you like the company, you'd be hoping this isn't the case so that you could potentially pick up some stock while it's out of favour.
Want the full picture on earnings, revenue and cash flow for the company? Then our free report on Henan Yuneng HoldingsLtd will help you shine a light on its historical performance.Do Revenue Forecasts Match The Low P/S Ratio?
There's an inherent assumption that a company should underperform the industry for P/S ratios like Henan Yuneng HoldingsLtd's to be considered reasonable.
Retrospectively, the last year delivered a frustrating 19% decrease to the company's top line. That put a dampener on the good run it was having over the longer-term as its three-year revenue growth is still a noteworthy 29% in total. Although it's been a bumpy ride, it's still fair to say the revenue growth recently has been mostly respectable for the company.
When compared to the industry's one-year growth forecast of 2.3%, the most recent medium-term revenue trajectory is noticeably more alluring
With this in mind, we find it intriguing that Henan Yuneng HoldingsLtd's P/S isn't as high compared to that of its industry peers. It looks like most investors are not convinced the company can maintain its recent growth rates.
The Bottom Line On Henan Yuneng HoldingsLtd's P/S
Despite Henan Yuneng HoldingsLtd's share price climbing recently, its P/S still lags most other companies. We'd say the price-to-sales ratio's power isn't primarily as a valuation instrument but rather to gauge current investor sentiment and future expectations.
Our examination of Henan Yuneng HoldingsLtd revealed its three-year revenue trends aren't boosting its P/S anywhere near as much as we would have predicted, given they look better than current industry expectations. When we see strong revenue with faster-than-industry growth, we assume there are some significant underlying risks to the company's ability to make money which is applying downwards pressure on the P/S ratio. It appears many are indeed anticipating revenue instability, because the persistence of these recent medium-term conditions would normally provide a boost to the share price.
Before you take the next step, you should know about the 2 warning signs for Henan Yuneng HoldingsLtd (1 is significant!) that we have uncovered.
If these risks are making you reconsider your opinion on Henan Yuneng HoldingsLtd, explore our interactive list of high quality stocks to get an idea of what else is out there.
Valuation is complex, but we're here to simplify it.
Discover if Henan Yuneng HoldingsLtd might be undervalued or overvalued with our detailed analysis, featuring fair value estimates, potential risks, dividends, insider trades, and its financial condition.
Access Free AnalysisHave feedback on this article? Concerned about the content? Get in touch with us directly. Alternatively, email editorial-team (at) simplywallst.com.
This article by Simply Wall St is general in nature. We provide commentary based on historical data and analyst forecasts only using an unbiased methodology and our articles are not intended to be financial advice. It does not constitute a recommendation to buy or sell any stock, and does not take account of your objectives, or your financial situation. We aim to bring you long-term focused analysis driven by fundamental data. Note that our analysis may not factor in the latest price-sensitive company announcements or qualitative material. Simply Wall St has no position in any stocks mentioned.
About SZSE:001896
Henan Yuneng HoldingsLtd
Through its subsidiaries, invests in, develops, generates, and sells electricity in China.
Fair value with acceptable track record.
Market Insights

Advertisement
Weekly Picks
RO


RockeTeller on Santacruz Silver Mining ·
Crazy Undervalued 42 Baggers Silver Play (Active & Running Mine)
Fair Value:CA$8696.4% undervalued
35 followersusers have followed this narrative
6 commentsusers have commented on this narrative
10 likesusers have liked this narrative
RO


Robbo on Fiducian Group ·
Fiducian: Compliance Clouds or Value Opportunity?
Fair Value:AU$126.1% undervalued
4 followersusers have followed this narrative
0 commentsusers have commented on this narrative
0 likesusers have liked this narrative
WO

woodworthfund on Willamette Valley Vineyards ·
Willamette Valley Vineyards (WVVI): Not-So-Great Value
Fair Value:US$244.5% overvalued
6 followersusers have followed this narrative
0 commentsusers have commented on this narrative
1 likeusers have liked this narrative
Recently Updated Narratives
FU

FundamentallySarcastic on Credit Corp Group ·
Moderation and Stabilisation: HOLD: Fair Price based on a 4-year Cycle is $12.08
Fair Value:AU$12.6411.4% overvalued
1 followerusers have followed this narrative
0 commentsusers have commented on this narrative
0 likesusers have liked this narrative
MA


MarkoVT on Alphabet ·
Positioned globally, partnered locally
Fair Value:US$390.1918.1% undervalued
2 followersusers have followed this narrative
0 commentsusers have commented on this narrative
0 likesusers have liked this narrative
JO


JohnJ on Worldline ·
When will fraudsters be investigated in depth. Fraud was ongoing in France too.
Fair Value:€0.5190.0% overvalued
1 followerusers have followed this narrative
0 commentsusers have commented on this narrative
0 likesusers have liked this narrative
Popular Narratives
TH


TheWallstreetKing on MicroVision ·
MicroVision will explode future revenue by 380.37% with a vision towards success
Fair Value:US$6098.5% undervalued
113 followersusers have followed this narrative
11 commentsusers have commented on this narrative
22 likesusers have liked this narrative
AN


AnalystConsensusTarget on NVIDIA ·
NVDA: Expanding AI Demand Will Drive Major Data Center Investments Through 2026
Fair Value:US$250.3928.3% undervalued
952 followersusers have followed this narrative
6 commentsusers have commented on this narrative
25 likesusers have liked this narrative
OS

oscargarcia on Alphabet ·
The company that turned a verb into a global necessity and basically runs the modern internet, digital ads, smartphones, maps, and AI.
Fair Value:US$3406.0% undervalued
148 followersusers have followed this narrative
6 commentsusers have commented on this narrative
18 likesusers have liked this narrative

