
Advertisement
- China
- /
- Infrastructure
- /
- SZSE:001965
China Merchants Expressway Network & Technology Holdings Co.,Ltd.'s (SZSE:001965) Intrinsic Value Is Potentially 25% Below Its Share Price

Key Insights
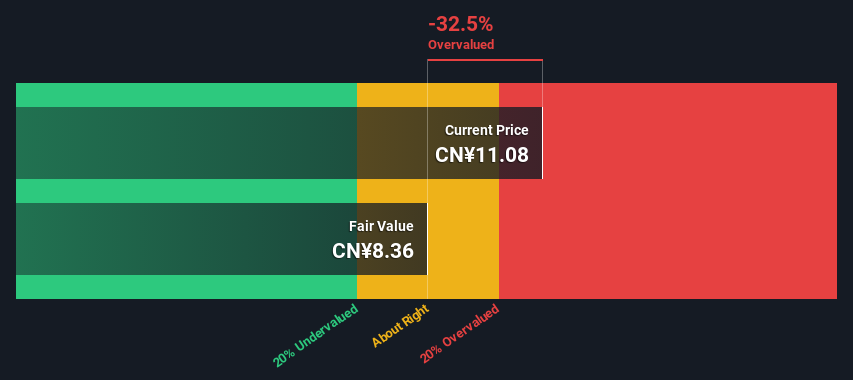
- China Merchants Expressway Network & Technology HoldingsLtd's estimated fair value is CN¥8.36 based on 2 Stage Free Cash Flow to Equity
- China Merchants Expressway Network & Technology HoldingsLtd's CN¥11.08 share price signals that it might be 32% overvalued
- Analyst price target for 1965 is CN¥13.14, which is 57% above our fair value estimate
Today we'll do a simple run through of a valuation method used to estimate the attractiveness of China Merchants Expressway Network & Technology Holdings Co.,Ltd. (SZSE:001965) as an investment opportunity by taking the expected future cash flows and discounting them to their present value. We will take advantage of the Discounted Cash Flow (DCF) model for this purpose. Don't get put off by the jargon, the math behind it is actually quite straightforward.
We would caution that there are many ways of valuing a company and, like the DCF, each technique has advantages and disadvantages in certain scenarios. If you still have some burning questions about this type of valuation, take a look at the Simply Wall St analysis model.
View our latest analysis for China Merchants Expressway Network & Technology HoldingsLtd
Step By Step Through The Calculation
We use what is known as a 2-stage model, which simply means we have two different periods of growth rates for the company's cash flows. Generally the first stage is higher growth, and the second stage is a lower growth phase. To begin with, we have to get estimates of the next ten years of cash flows. Seeing as no analyst estimates of free cash flow are available to us, we have extrapolate the previous free cash flow (FCF) from the company's last reported value. We assume companies with shrinking free cash flow will slow their rate of shrinkage, and that companies with growing free cash flow will see their growth rate slow, over this period. We do this to reflect that growth tends to slow more in the early years than it does in later years.
Generally we assume that a dollar today is more valuable than a dollar in the future, so we need to discount the sum of these future cash flows to arrive at a present value estimate:
10-year free cash flow (FCF) estimate
| 2024 | 2025 | 2026 | 2027 | 2028 | 2029 | 2030 | 2031 | 2032 | 2033 | |
| Levered FCF (CN¥, Millions) | CN¥4.78b | CN¥5.10b | CN¥5.38b | CN¥5.64b | CN¥5.88b | CN¥6.10b | CN¥6.32b | CN¥6.53b | CN¥6.74b | CN¥6.96b |
| Growth Rate Estimate Source | Est @ 8.22% | Est @ 6.64% | Est @ 5.53% | Est @ 4.75% | Est @ 4.21% | Est @ 3.83% | Est @ 3.56% | Est @ 3.38% | Est @ 3.24% | Est @ 3.15% |
| Present Value (CN¥, Millions) Discounted @ 12% | CN¥4.3k | CN¥4.1k | CN¥3.8k | CN¥3.6k | CN¥3.3k | CN¥3.1k | CN¥2.8k | CN¥2.6k | CN¥2.4k | CN¥2.2k |
("Est" = FCF growth rate estimated by Simply Wall St)
Present Value of 10-year Cash Flow (PVCF) = CN¥32b
After calculating the present value of future cash flows in the initial 10-year period, we need to calculate the Terminal Value, which accounts for all future cash flows beyond the first stage. For a number of reasons a very conservative growth rate is used that cannot exceed that of a country's GDP growth. In this case we have used the 5-year average of the 10-year government bond yield (2.9%) to estimate future growth. In the same way as with the 10-year 'growth' period, we discount future cash flows to today's value, using a cost of equity of 12%.
Terminal Value (TV)= FCF2033 × (1 + g) ÷ (r – g) = CN¥7.0b× (1 + 2.9%) ÷ (12%– 2.9%) = CN¥78b
Present Value of Terminal Value (PVTV)= TV / (1 + r)10= CN¥78b÷ ( 1 + 12%)10= CN¥25b
The total value, or equity value, is then the sum of the present value of the future cash flows, which in this case is CN¥57b. The last step is to then divide the equity value by the number of shares outstanding. Relative to the current share price of CN¥11.1, the company appears reasonably expensive at the time of writing. Remember though, that this is just an approximate valuation, and like any complex formula - garbage in, garbage out.
Important Assumptions
We would point out that the most important inputs to a discounted cash flow are the discount rate and of course the actual cash flows. Part of investing is coming up with your own evaluation of a company's future performance, so try the calculation yourself and check your own assumptions. The DCF also does not consider the possible cyclicality of an industry, or a company's future capital requirements, so it does not give a full picture of a company's potential performance. Given that we are looking at China Merchants Expressway Network & Technology HoldingsLtd as potential shareholders, the cost of equity is used as the discount rate, rather than the cost of capital (or weighted average cost of capital, WACC) which accounts for debt. In this calculation we've used 12%, which is based on a levered beta of 1.630. Beta is a measure of a stock's volatility, compared to the market as a whole. We get our beta from the industry average beta of globally comparable companies, with an imposed limit between 0.8 and 2.0, which is a reasonable range for a stable business.
SWOT Analysis for China Merchants Expressway Network & Technology HoldingsLtd
Strength
- Earnings growth over the past year exceeded the industry.
- Debt is well covered by earnings.
- Dividends are covered by earnings and cash flows.
- Dividend is in the top 25% of dividend payers in the market.
Weakness
- Shareholders have been diluted in the past year.
Opportunity
- Annual earnings are forecast to grow for the next 3 years.
- Good value based on P/E ratio compared to estimated Fair P/E ratio.
Threat
- Debt is not well covered by operating cash flow.
- Annual earnings are forecast to grow slower than the Chinese market.
Next Steps:
Valuation is only one side of the coin in terms of building your investment thesis, and it ideally won't be the sole piece of analysis you scrutinize for a company. It's not possible to obtain a foolproof valuation with a DCF model. Preferably you'd apply different cases and assumptions and see how they would impact the company's valuation. For instance, if the terminal value growth rate is adjusted slightly, it can dramatically alter the overall result. Can we work out why the company is trading at a premium to intrinsic value? For China Merchants Expressway Network & Technology HoldingsLtd, we've compiled three pertinent factors you should further examine:
- Risks: You should be aware of the 3 warning signs for China Merchants Expressway Network & Technology HoldingsLtd (1 makes us a bit uncomfortable!) we've uncovered before considering an investment in the company.
- Future Earnings: How does 001965's growth rate compare to its peers and the wider market? Dig deeper into the analyst consensus number for the upcoming years by interacting with our free analyst growth expectation chart.
- Other Solid Businesses: Low debt, high returns on equity and good past performance are fundamental to a strong business. Why not explore our interactive list of stocks with solid business fundamentals to see if there are other companies you may not have considered!
PS. The Simply Wall St app conducts a discounted cash flow valuation for every stock on the SZSE every day. If you want to find the calculation for other stocks just search here.
New: AI Stock Screener & Alerts
Our new AI Stock Screener scans the market every day to uncover opportunities.
• Dividend Powerhouses (3%+ Yield)
• Undervalued Small Caps with Insider Buying
• High growth Tech and AI Companies
Or build your own from over 50 metrics.
Have feedback on this article? Concerned about the content? Get in touch with us directly. Alternatively, email editorial-team (at) simplywallst.com.
This article by Simply Wall St is general in nature. We provide commentary based on historical data and analyst forecasts only using an unbiased methodology and our articles are not intended to be financial advice. It does not constitute a recommendation to buy or sell any stock, and does not take account of your objectives, or your financial situation. We aim to bring you long-term focused analysis driven by fundamental data. Note that our analysis may not factor in the latest price-sensitive company announcements or qualitative material. Simply Wall St has no position in any stocks mentioned.
About SZSE:001965
China Merchants Expressway Network & Technology HoldingsLtd
China Merchants Expressway Network & Technology Holdings Co.,Ltd.
Undervalued with proven track record and pays a dividend.
Market Insights


Advertisement
Community Narratives
Nike's Direct-to-Consumer Focus Will Drive Future Growth
Fair Value US$87.90|18.2% undervalued
UN
Community Contributor
Novo Nordisk will dominate GLP-1 market with Ozempic and Wegovy growth
Fair Value US$89.59|12.1% undervalued
BE
Community Contributor
Rheinmetall could get 20-25% of EU-NATO 3%-GDP defence spending
Fair Value €7.57k|82.8% undervalued
NO
Community Contributor