
Advertisement
- China
- /
- Tech Hardware
- /
- SZSE:301067
Fullink Technology Co.,Ltd's (SZSE:301067) Shares Climb 31% But Its Business Is Yet to Catch Up
Those holding Fullink Technology Co.,Ltd (SZSE:301067) shares would be relieved that the share price has rebounded 31% in the last thirty days, but it needs to keep going to repair the recent damage it has caused to investor portfolios. The last 30 days bring the annual gain to a very sharp 25%.
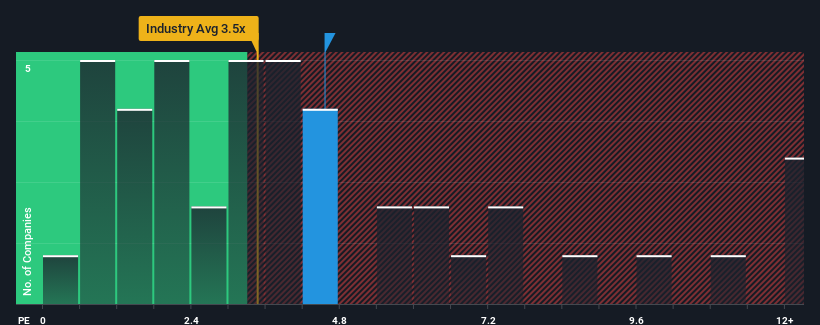
Since its price has surged higher, given close to half the companies operating in China's Tech industry have price-to-sales ratios (or "P/S") below 3.5x, you may consider Fullink TechnologyLtd as a stock to potentially avoid with its 4.6x P/S ratio. However, the P/S might be high for a reason and it requires further investigation to determine if it's justified.
See our latest analysis for Fullink TechnologyLtd
How Has Fullink TechnologyLtd Performed Recently?
For example, consider that Fullink TechnologyLtd's financial performance has been poor lately as its revenue has been in decline. It might be that many expect the company to still outplay most other companies over the coming period, which has kept the P/S from collapsing. If not, then existing shareholders may be quite nervous about the viability of the share price.
Although there are no analyst estimates available for Fullink TechnologyLtd, take a look at this free data-rich visualisation to see how the company stacks up on earnings, revenue and cash flow.Do Revenue Forecasts Match The High P/S Ratio?
The only time you'd be truly comfortable seeing a P/S as high as Fullink TechnologyLtd's is when the company's growth is on track to outshine the industry.
Taking a look back first, the company's revenue growth last year wasn't something to get excited about as it posted a disappointing decline of 14%. That put a dampener on the good run it was having over the longer-term as its three-year revenue growth is still a noteworthy 17% in total. Accordingly, while they would have preferred to keep the run going, shareholders would be roughly satisfied with the medium-term rates of revenue growth.
Comparing the recent medium-term revenue trends against the industry's one-year growth forecast of 25% shows it's noticeably less attractive.
With this in mind, we find it worrying that Fullink TechnologyLtd's P/S exceeds that of its industry peers. It seems most investors are ignoring the fairly limited recent growth rates and are hoping for a turnaround in the company's business prospects. Only the boldest would assume these prices are sustainable as a continuation of recent revenue trends is likely to weigh heavily on the share price eventually.
The Final Word
The large bounce in Fullink TechnologyLtd's shares has lifted the company's P/S handsomely. Using the price-to-sales ratio alone to determine if you should sell your stock isn't sensible, however it can be a practical guide to the company's future prospects.
The fact that Fullink TechnologyLtd currently trades on a higher P/S relative to the industry is an oddity, since its recent three-year growth is lower than the wider industry forecast. When we observe slower-than-industry revenue growth alongside a high P/S ratio, we assume there to be a significant risk of the share price decreasing, which would result in a lower P/S ratio. If recent medium-term revenue trends continue, it will place shareholders' investments at significant risk and potential investors in danger of paying an excessive premium.
And what about other risks? Every company has them, and we've spotted 3 warning signs for Fullink TechnologyLtd (of which 2 don't sit too well with us!) you should know about.
Of course, profitable companies with a history of great earnings growth are generally safer bets. So you may wish to see this free collection of other companies that have reasonable P/E ratios and have grown earnings strongly.
New: AI Stock Screener & Alerts
Our new AI Stock Screener scans the market every day to uncover opportunities.
• Dividend Powerhouses (3%+ Yield)
• Undervalued Small Caps with Insider Buying
• High growth Tech and AI Companies
Or build your own from over 50 metrics.
Have feedback on this article? Concerned about the content? Get in touch with us directly. Alternatively, email editorial-team (at) simplywallst.com.
This article by Simply Wall St is general in nature. We provide commentary based on historical data and analyst forecasts only using an unbiased methodology and our articles are not intended to be financial advice. It does not constitute a recommendation to buy or sell any stock, and does not take account of your objectives, or your financial situation. We aim to bring you long-term focused analysis driven by fundamental data. Note that our analysis may not factor in the latest price-sensitive company announcements or qualitative material. Simply Wall St has no position in any stocks mentioned.
About SZSE:301067
Fullink TechnologyLtd
Engages in the research and development, production, and sales of computer, communication, and consumer electronics peripheral products and components in China.
Slight risk with mediocre balance sheet.
Market Insights

Advertisement
Weekly Picks
FA

FAI on Arabian Internet and Communication Services ·
Solutions by stc: 34% Upside in Saudi's Digital Transformation Leader
Fair Value:ر.س342.2335.7% undervalued
10 followersusers have followed this narrative
1 commentusers have commented on this narrative
3 likesusers have liked this narrative
RO


RobertoAllende on NVIDIA ·
The AI Infrastructure Giant Grows Into Its Valuation
Fair Value:US$345.0747.9% undervalued
27 followersusers have followed this narrative
28 commentsusers have commented on this narrative
21 likesusers have liked this narrative
Recently Updated Narratives
TA


Talos on PayPal Holdings ·
The "Sleeping Giant" Wakes Up – Efficiency & Monetization
Fair Value:US$174.9264.2% undervalued
2 followersusers have followed this narrative
0 commentsusers have commented on this narrative
0 likesusers have liked this narrative
TA

Talos on Pagaya Technologies ·
The "Rate Cut" Supercycle Winner – Profitable & Accelerating
Fair Value:US$170.685.9% undervalued
1 followerusers have followed this narrative
1 commentusers have commented on this narrative
0 likesusers have liked this narrative
TA

Talos on Archer Aviation ·
The Industrialist of the Skies – Scaling with "Automotive DNA
Fair Value:US$16.3254.3% undervalued
1 followerusers have followed this narrative
0 commentsusers have commented on this narrative
0 likesusers have liked this narrative
Popular Narratives
TH


TheWallstreetKing on MicroVision ·
MicroVision will explode future revenue by 380.37% with a vision towards success
Fair Value:US$6098.6% undervalued
111 followersusers have followed this narrative
11 commentsusers have commented on this narrative
22 likesusers have liked this narrative
AN

AnalystConsensusTarget on NVIDIA ·
NVDA: Expanding AI Demand Will Drive Major Data Center Investments Through 2026
Fair Value:US$250.3928.1% undervalued
945 followersusers have followed this narrative
6 commentsusers have commented on this narrative
24 likesusers have liked this narrative
OS


oscargarcia on Alphabet ·
The company that turned a verb into a global necessity and basically runs the modern internet, digital ads, smartphones, maps, and AI.
Fair Value:US$3407.4% undervalued
146 followersusers have followed this narrative
6 commentsusers have commented on this narrative
18 likesusers have liked this narrative